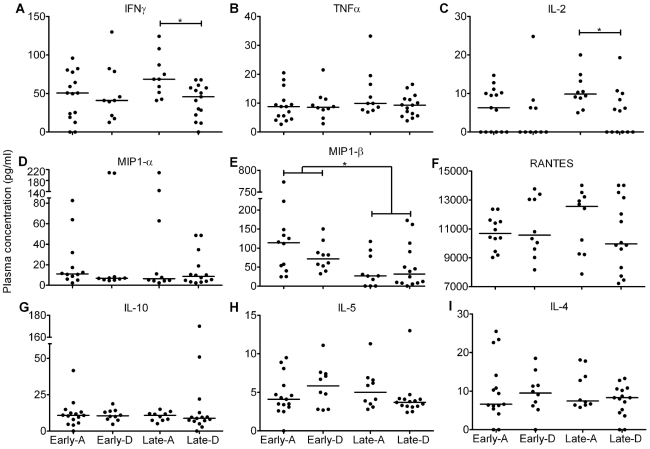
Figure 4. Individual profiles for all cytokines and chemokines measured.
Vertical scatter plots show the median plasma concentration (horizontal black line; pg/ml) for the anti-HIV-1 cytokines (IFNγ, TNFα, IL-2, IL-10, IL-5 and IL-4) and chemokines (MIP-1α, MIP-1β and RANTES) measured as part of this study. Participants were analysed in four groups based on disease stage and HIV clade: Early-A, Early-D, Late-A and Late-D. * = p<0.05 and ** = p<0.0001, calculated using Mann Whitney test.

