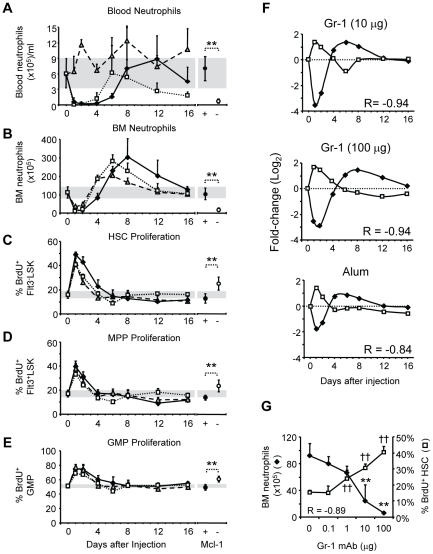
Figure 2. Adjuvant inflammation and experimental neutropenia elicit similar changes in granulopoiesis.
BL/6 mice were i.p. injected with Gr-1 mAb [10 µg (open squares), 100 µg (closed diamonds)] or alum (shaded triangles), and then blood and BM neutrophils were enumerated at various intervals. Neutrophils numbers were also determined in Mcl-1- mice and control littermates. The mean(+SD) numbers of neutrophils/ml of blood (A) and in the four leg bones (B) after each treatment are shown. In the right panel, the numbers of blood and BM neutrophils in Mcl-1+ and Mcl-1− mice are indicated. Proliferation of HSC (C), MPP (D), and GMP (E) at intervals after alum or Gr-1 treatment, and in Mcl-1+ and Mcl-1− mice, was determined by BrdU incorporation. Mice were injected with BrdU 6 hours prior to sacrifice, and the mean frequency(+SD) of BrdU+ cells in each compartment is shown (day 0, n = 19; for other intervals, n = 3–10). (F) BM neutrophil numbers (closed diamonds) and frequencies of BrdU+ HSC (open squares) after injection of Gr-1 or alum (as shown in B and C) are co-plotted; the values at each interval represent the fold change from naïve mice, expressed as log2. Pearson product moment correlation coefficients (R) between BM neutrophil numbers and the frequencies of BrdU+ HSC for each treatment are shown. (G) BL/6 mice were injected with graded amounts of Gr-1 mAb (0, 0.1, 1, 10, and 100 µg; n = 4–7 mice per treatment) and then BM neutrophil numbers and HSC proliferation were determined two days later. Significant differences from naïve BL/6 mice are shown for neutrophil numbers (**, P≤0.01) and frequency of BrdU+ HSC (††, P≤0.01); the Pearson product moment correlation coefficient (R) for BM neutrophil numbers and frequencies of BrdU+ HSC is shown.

