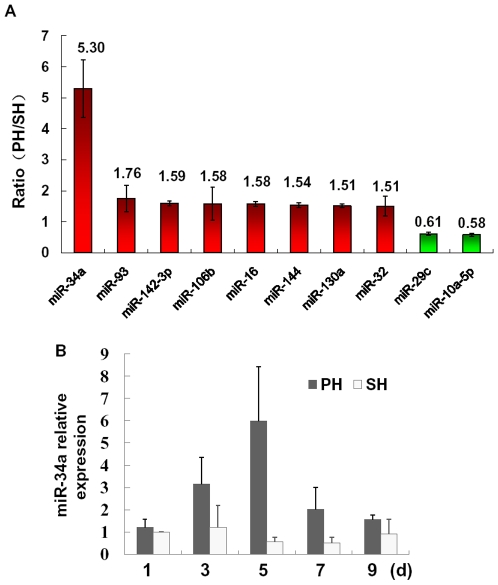
Figure 1. Differentially expressed miRNAs during liver regeneration (LR).
(A) miRNA expression profiling at 5 d after partial hepatectomy (PHx). Each data point represents the ratio of miRNA expression levels under PHx to Sham operation (SH). Ratio values >1.5 or <0.7 were considered up-regulated (red) or down-regulated (green) in PHx rats compared to SH rats. (B) The expression pattern of miR-34a during LR by quantitative real-time PCR (qRT-PCR) analysis. miR-34a levels were normalized to that of u6. * P<0.05, ** P<0.01, vs SH control at each time point.

