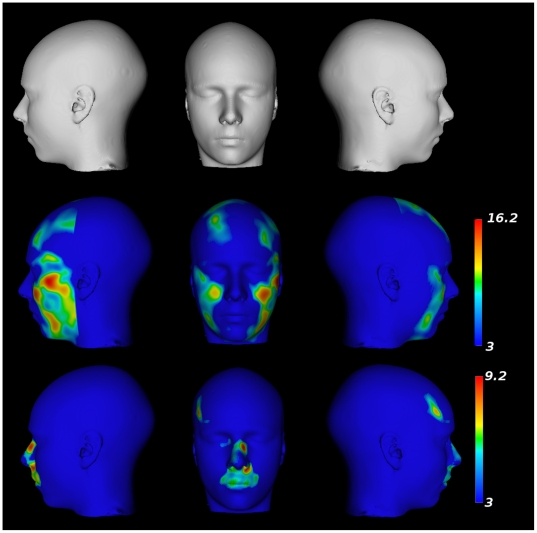
Figure 3. Results from the voxel-by-voxel analysis of deformation fields.
Top Row: A surface rendered version of the population-based atlas. Middle Row: Parametric map projected onto the surface showing regions yielding statistically larger expansions in males in comparison to females. Bottom Row: Parametric map projected onto the surface showing regions yielding statistically larger expansions in females in comparison to males.

