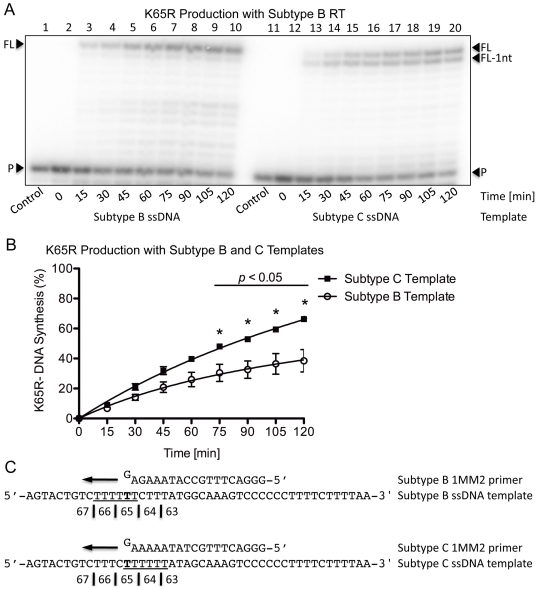
Figure 2. K65R production rates with subtype B RT on subtype B and C templates with primers containing the mutagenic nt.
(A) Lanes 1 through 10 depict (+)dsDNA synthesis from the (-)ssDNA intermediate with subtype B RT on the subtype B template. The full-length product is observed as a single band at the FL position. Lanes 11 through 20 depict (+)dsDNA synthesis from the (−)ssDNA intermediate with subtype B RT on the subtype C template. The full-length product is observed as two distinct bands at the FL and FL-1nt positions, which is indicative of dislocation on the subtype C template. (B) Graphical representation of the amount of transcripts containing the mutagenic nt produced with subtype B RT on both subtype B and C templates. The values indicated with an asterisk have a p-value <0.05 when the amount of K65R-production between both subtypes at the given time-point is compared. More transcripts with the mutagenic G at position 65 are produced with the subtype C template than with the subtype B template. (C) Depiction of the primer and template systems used. The primers contain a G base on their 3′-end that becomes mismatched on the T on the template strand thus yielding transcripts with the mutagenic nt. The homopolymeric regions of both templates are underlined and the base responsible for the K65R mutation is indicated in bold.

