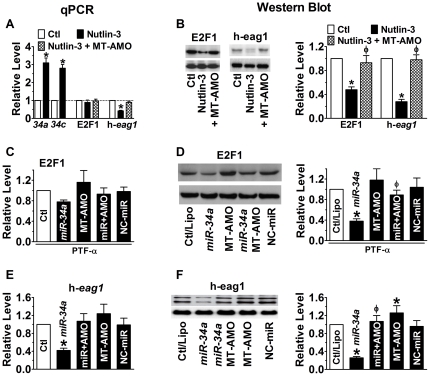
Figure 4. Anti-correlation between p53 activity and expression of E2F1 and h-eag1.
(A & B) Effects of p53 activation by Mdm2 inhibitor nutlin-3 (1 µM) on expression of miR-34, E2F1 and h-eag1 at mRNA and protein levels. SHSY5Y cells were pretreated with nutlin-3 and then transfected with MT-AMO. *p<0.05 vs Ctl/Lipo; φ p<0.05 vs Nutlin-3 alone; n = 4 for each group. (C & D) Downregulation of E2F1 at both mRNA and protein levels by miR-34a in the presence of p53 inhibitor Pifithrin-alpha (PFT-α; 30 µM). SHSY5Y cells were pretreated with PFT and then transfected with miR-34a. MT-AMO: an antisense oligomer to miR-34a, miR-34b and miR-34c; miR+AMO: co-transfection of miR-34a and MT-AMO; NC-miR: scrambled negative control miRNA. Control cells were mock-treated with lipofectamine 2000. *p<0.05 vs Ctl/Lipo; φ p<0.05 vs miR-34a alone; n = 4 for each group. (E & F) Downregulation of h-eag1 at both mRNA and protein levels by miR-34a in the presence of p53 inhibitor Pifithrin-alpha (PFT-α; 30 µM). The immunoblot bands shown were run on the same gel. *p<0.05 vs Ctl/Lipo; φ p<0.05 vs miR-34a alone; n = 4 for each group.

