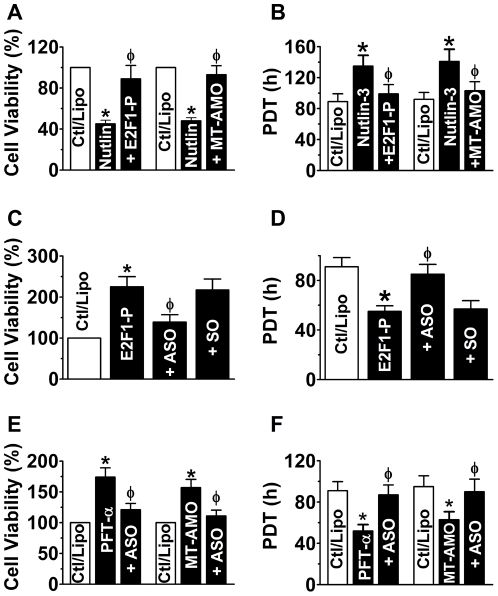
Figure 7. Effects of the p53−miR-34−E2F1−h-eag1 pathway on cell proliferation.
(A & B) Effects of p53 activation by nutlin-3 (1 µM), E2F1 overexpression and miR-34 knockdown on SHSY5Y cell proliferation evaluated with MTT assay (A) and by population doubling time (PDT) with flow cytometry methods (B). Cells were pretreated with nutlin-3 to activate p53 and then transfected with the plasmid carrying E2F1 cDNA for overexpression (E2F1-P) or MT-AMO to knockdown miR-34; control cells (Ctl/Lipo) were mock-treated with lipofectamine 2000. *p<0.05 vs Ctl/Lipo; φ p<0.05 vs Nutlin-3 alone; n = 4 for each group. (C & D) Effect of the antisense oligodeoxynucleotides (ASO) directed against h-eag gene on SHSY5Y cell growth induced by E2F1 overexpression, evaluated with MTT assay (C) and by PDT using flow cytometry methods (D). Cells were transfected with E2F1 plasmid alone (E2F1-P) or co-transfected with E2F1 plasmid and ASO (+ASO) or SO (sense oligomer for negative control; +SO). *p<0.05 vs Ctl/Lipo; φ p<0.05 vs E2F1-P alone; n = 4 for each group. (E & F) Effects of antisense to h-eag1 (ASO) on cell-growth stimulation by PTF-α-induced p53 inactivation in SHSY5Y cells, determined by MTT (E) and by PDT (F). Cells were pretreated with PFT-α (30 µM) to inactivate p53 or transfected with MT-AMO, and then transfected with ASO; control cells (Ctl/Lipo) were mock-treated with lipofectamine 2000. *p<0.05 vs Ctl/Lipo; φ p<0.05 vs PFT-α alone; n = 5 for each group.

