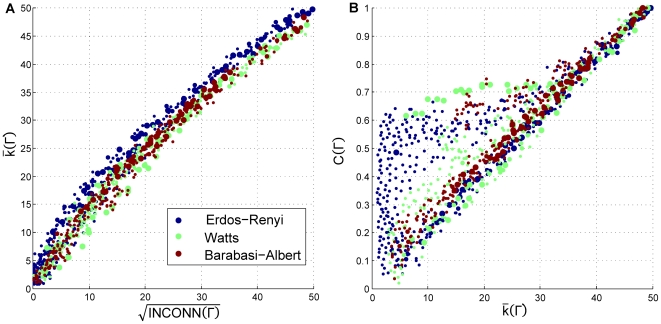
Figure 5. Distribution of tested data points obtained by sampling network topologies with radius 1 and 2.
The distribution of the sampled network topologies, projected onto two dimensional views of key network statistics. The left panel shows sampled network topologies projected onto the square root of interconnectedness and the average degree of the network, while the right panel describes the sample density in the average degree and the clustering coefficient space.

