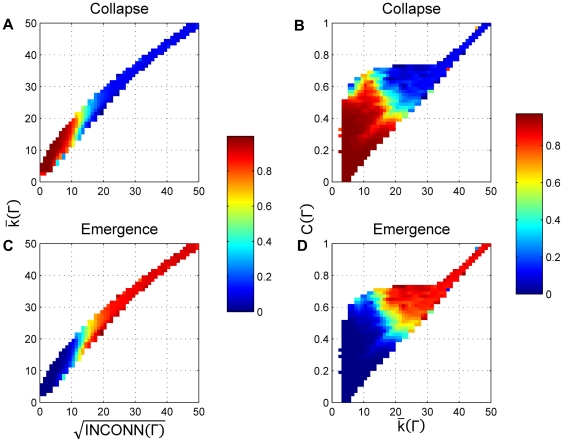
Figure 6. Proportion of time spent in the emergence and collapse zones.
Proportion of time that the simulation spends in the norm collapse and emergence zones as a function of key network statistics using similar projections as those in Figure 5. Color codes the fraction of simulation time spent in each zone computed for each bin. Time spent outside either zone is insignificant.

