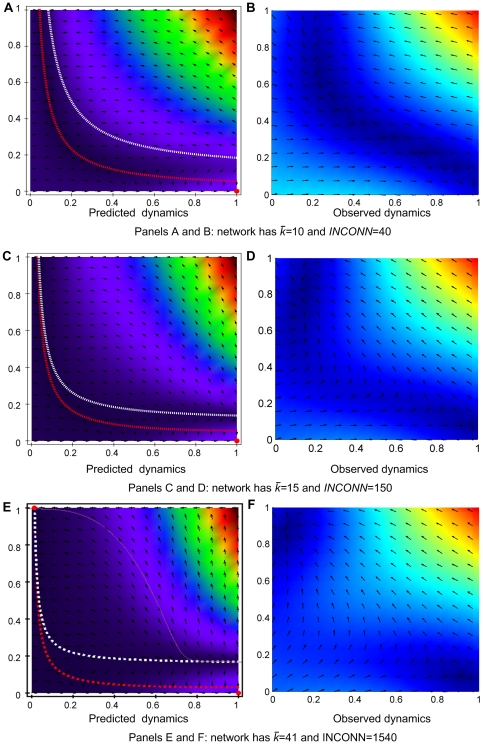
Figure 7. Predicted versus observed dynamics of the metanorms game for three networks.
For simulated results, the mutation rate was set to 0.01. Color codes the speeds of movement of the population, either computed analytically or measured from the simulation with blue being the slowest and red the fastest. Figure 3 contains the legend for the graphs. In panel B, simulated population spends 95% of time in norm collapse zone. In panel D, the proportion of time in the norm collapse zone drops to 50%. In panel E, the simulation spends 95% of time in the norm emergence zone and 5% in the norm collapse zone.

