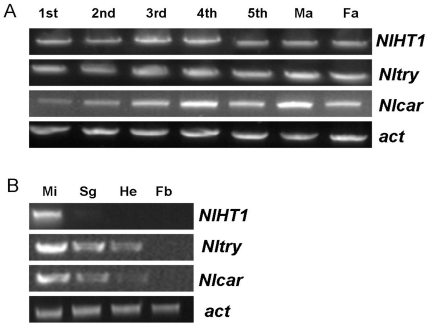
Figure 3. Transcription profiles of NlHT1, Nltry, and Nlcar at different developmental stages and in different tissues.
(A) Transcript levels of the three genes in N. lugens developmental stages from 1st nymph to male adult (Ma) and female adult (Fa). (B) Transcript levels in tissues of N. lugens 3rd instar nymphs: midgut (Mi), salivary gland (Sg), fat body (Fb), and head (He).

