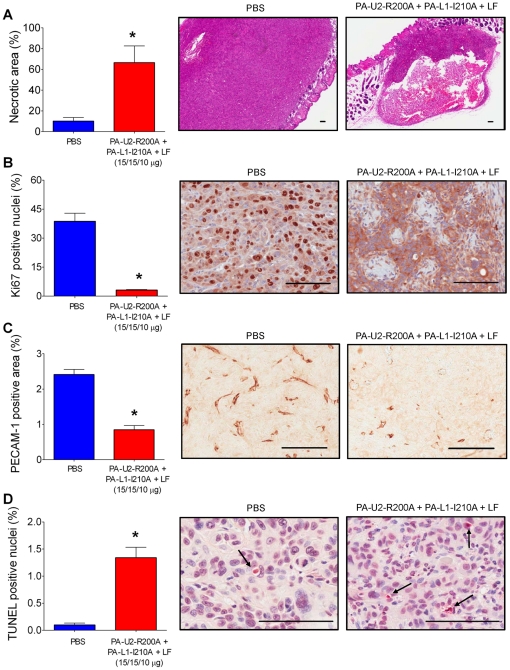
Figure 3. Increased necrosis and apoptosis and decreased proliferation and vessel density of human HN12 xenografts in intercomplementing toxin-treated mice.
Necrosis (A), proliferation (B), tumor vascularization (C), and apoptosis (D) of HN12 xenografts 5 days after initiation of systemic treatment with either PBS (blue bars and left panels) or intercomplementing toxin (red bars and right panels). A, hematoxylin and eosin staining. B, Ki67 staining. C, PECAM-1 staining. D, TUNEL staining. The arrows in D highlight examples of TUNEL positive cells. Columns, mean; bars, standard error of the mean, *, P<0.05. In all cases, representative images are shown. Scale Bars; 100 µM.

