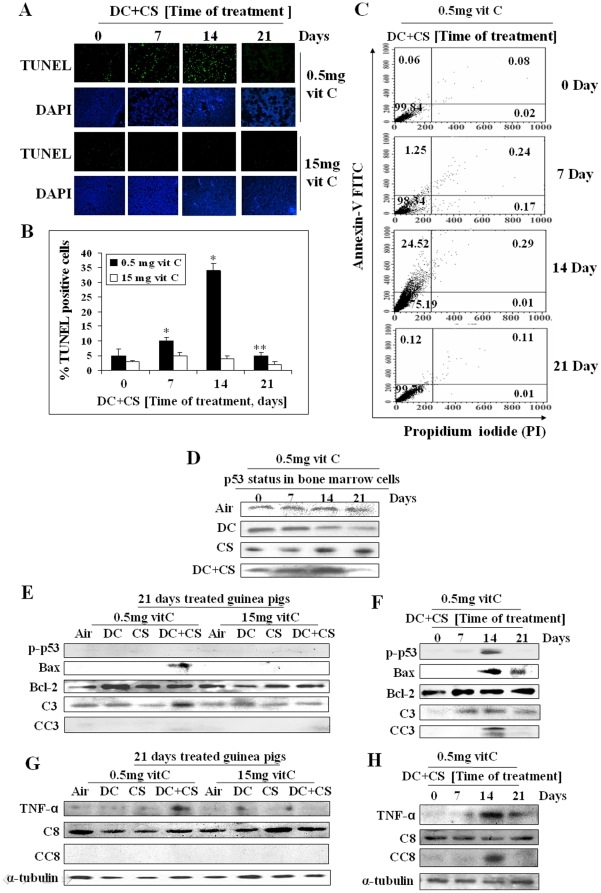
Figure 3. Assessment of apoptosis by TUNEL assay, flow cytometry and cell signaling in bone marrow cells of guinea pigs.
(Panel A) TUNEL assay of bone marrow cells. The rows were stained with fluorescein labeled dUTP and 4, 6-diamidino-2-phenylindole (DAPI), respectively; green fluorescence indicates TUNEL positive cells (magnification 200×). (Panel B) Quantitative evaluation of TUNEL positive cells; bars (means ± SD, n = 6) over the respective columns represent TUNEL positive cells, * significantly different (p<0.05) with respect to 0 day, ** significantly different (p<0.05) from 14 days treatment. (Panel C) Flow cytometry analyses of bone marrow cells using Annexin V-FITC fluorescence (Y-axis) vs PI (X-axis); quadrants: lower left, viable cells; upper left, apoptotic cells; upper right, late apoptotic and lower right, necrotic cells. (Panel D) p53 status in the bone marrow cells at different time. (Panel E) and (Panel F) Immunoblots of p-p53 (phospho-p53), Bax, Bcl-2, caspase 3 (C3), cleaved caspase 3 (CC3). (Panel G) and (Panel H) Immunoblots of TNF-α, caspase 8 (C8) and cleaved caspase 8 (CC8). Vit C means vitamin C.

