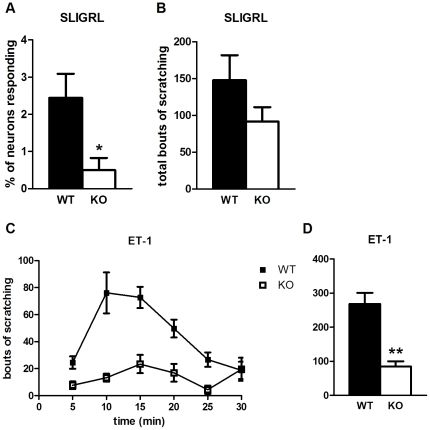
Figure 3. SLIGRL- and ET-1-induced responses are Pirt-dependent.
(A) Cellular responses to SLIGRL (130 µM) are fewer in DRG neurons from Pirt−/− mice (n = 5 per genotype). (B) Pirt mutants (n = 11) scratch less than WT mice (n = 13) upon SLIGRL injection (0.1 µmol), but the difference is not statistically significant. (C, D) ET-1 (10 pmol) generates a decreased behavioral response in Pirt KO (n = 10) versus WT (n = 9). * p<0.05, ** p<0.001; two-tailed unpaired t-test.

