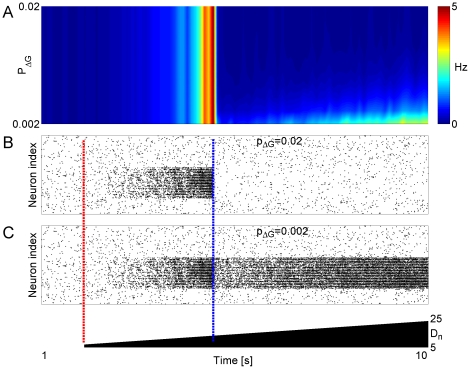
Figure 6. Changes in network topology and membrane conductance underlie the overall effect of gap junction connectivity on the network stability.
A Color panel is the surface plot of firing rate (averaged
over non-overlapping bins of 100 ms and over all model neurons) vs. the
probability  to
increase the leak conductance by
  in each
one of the model neurons from the affected area
(
 ,
, ) that did
not previously share gap junction connection. Color code is blue for low
firing rate and red for high firing rate. Horizontal axis is simulation
time ([0–10] seconds). Background noise intensity
 for the
set of
  model
neurons was perturbed at
  (dashed
red line through Panels B,C), and progressively increased to achieve
5-fold higher values at time 10 seconds (scale bar in lowest panel).
Membrane leak conductance for
  model
neurons was increased (as specified by
  ) at time
 (dashed
blue line through Panels B,C). B Raster plot of
network's activity for
  . Other
parameters:
  .
C Third panel: Raster plot of network's activity
for
  . Other parameters:
 .
.

