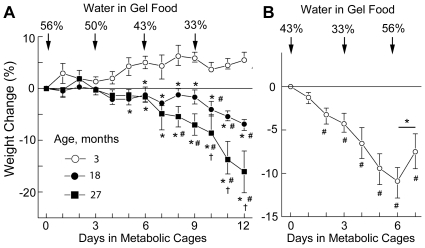
Figure 2. Analysis of hydration based on changes of body weight.
A) Changes of body weight resulting from decreased water intake in mice of different ages. Data are presented as % weight change relative to the weight at the beginning of the experiment (median and IQR, n = 3–4, * P<0.05 relative to 3 month old mice; # P<0.05 relative to 0 time; † P<0.05 relative to 18 month old mice). 3 month old mice do not lose weight, despite decreasing water intake. 18 and 27 month old mice lose weight when water content of the gel food falls to 43% - 33%. 27 month old mice lose the most weight and are very dehydrated by the end of the experiment. B) Reversal of progressive weight loss when low water content of the gel food is increased. 16 month old mice were subjected to consecutive periods (3 days each) of 43%, then 33% water in their gel food, which caused weight loss that progressed over 6 days. On day 7 when the water content of the gel food was increased to 56%, the mice began regaining weight. This rapid onset of weight gain when water intake was increased supports our use of weight as a measure of water balance. Data are plotted as Median and IQR; n = 4, (#) P<0.05 relative to 0 time. (*): P = 0.06 if Mann-Whitney Test (one-tailed, paired) is used, P = 0.002 if Student t-test (one-tailed, paired) is used. Note: the experiments shown on panels A and B are not directly compatible because the diets differed (see Methods for details).

