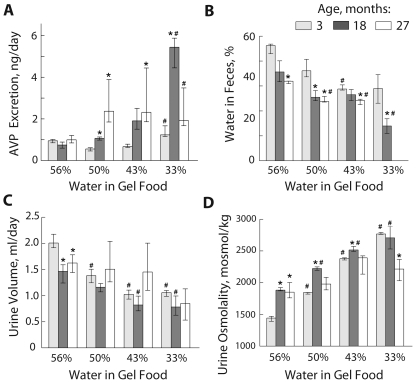
Figure 3. Analysis of activation of water conservation mechanisms at different levels of water consumption.
A) AVP excretion; B) % of water in feces; Note: data are missing for 27 month old mice when gel food contained 33% of water because the mice became constipated; C) Urine volume; D) Urine Osmolality. Data are presented as median and IQR, n = 3–4, * P<0.05 relative to 3 months old; # P<0.05 relative to 56% water in gel food; Mann-Whitney Test (one-tailed).

