
Figure 2.
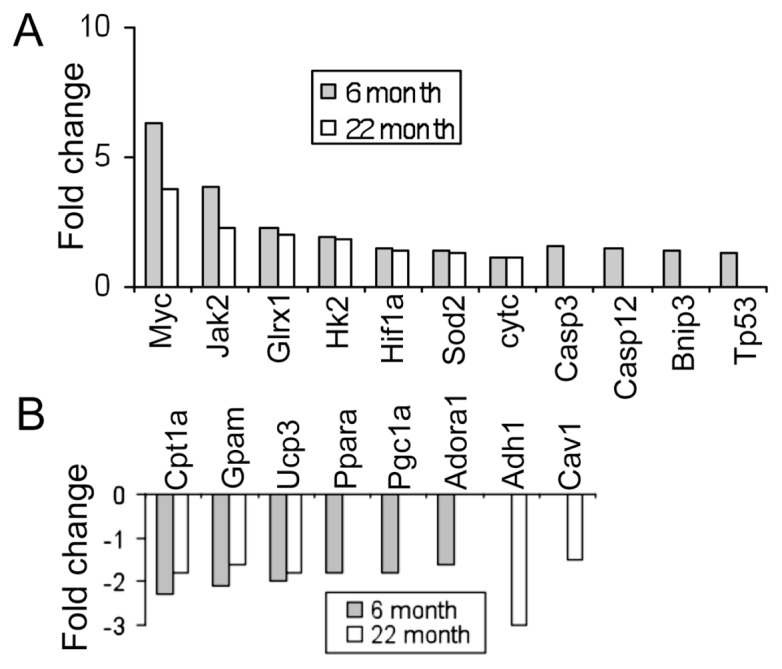
Mitochondrial gene expression changes following T-H. Changes in expression of a subset of mitochondrial genes following T-H in two different age groups (6- and 22- months). Upregulated (A) and downregulated (B) genes in each group are shown as bars. Bars represent mean fold change with a P < 0.05.