
Figure 8.
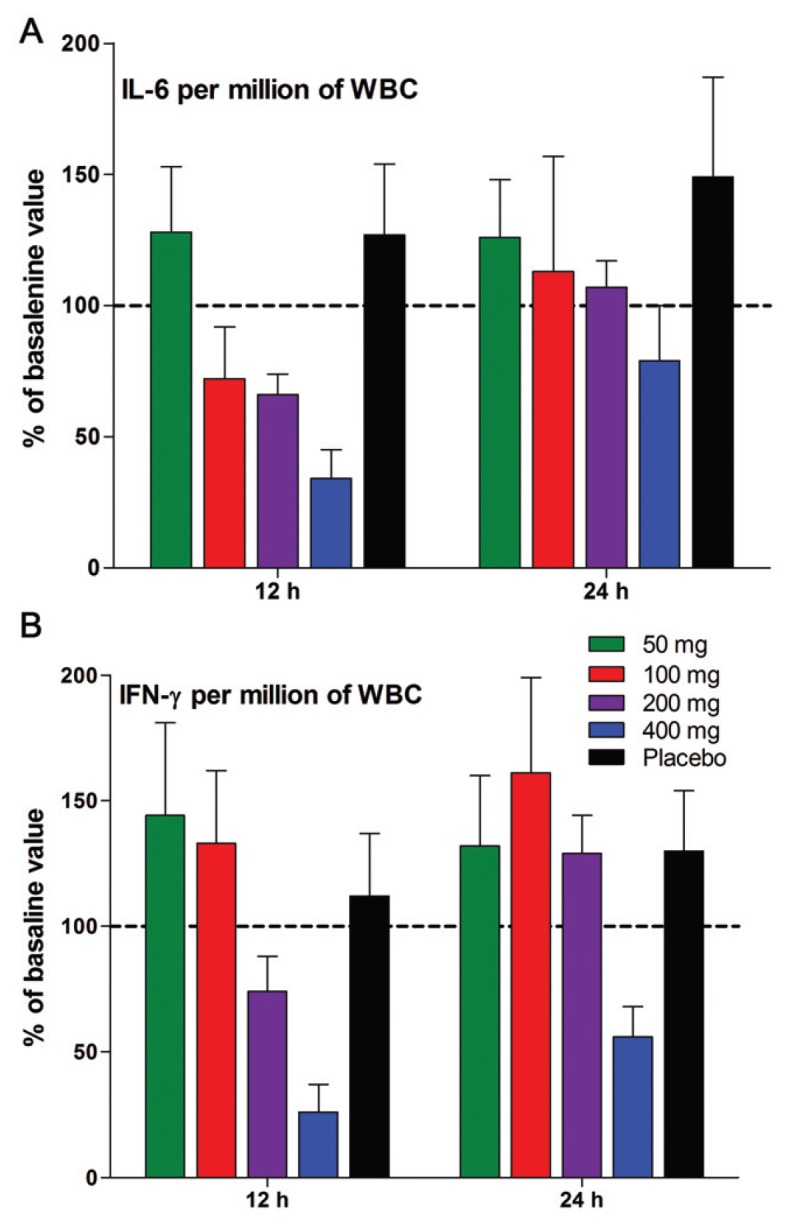
LPS-induced IL-6 and IFNγ per WBC. (A) Mean ± SEM of IL-6 per million WBC expressed as percent change of basal production just before the oral dosing. The hours after the dose are indicated under the horizontal axis. (B) IFNγ in the same sample shown in A. n = 9 for each group.