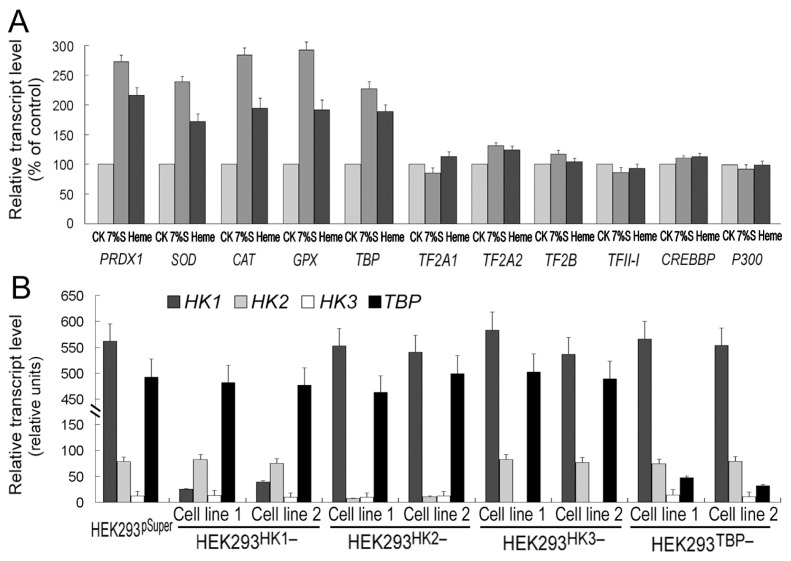
Figure 3.
Representative gene expression in control or silenced HEK293 cell lines. (A) The 7% glucose (7%S) and 50 μmol/L heme increase PRDX1, SOD, CAT, GPX and TBP expression but have no effect on the other six representative transcription factor genes in HEK293 cells. The treatment time was 24 h. Gene expression levels of the cells without any treatment (CK) are normalized to 100%. (B) HK1, HK2, HK3 and TBP expression levels in HEK293HK1−, HEK293HK2−, HEK293HK3− and HEK293TBP− gene-silenced cell lines and the HEK293pSuper control cell lines. Two independent gene-silenced cell lines for each gene were tested. Gene expression levels were detected by quantitative real-time PCR. Gene-expressing detection was performed with Actin1 transcript as a loading control. Error bars show standard deviations (n = 3).

