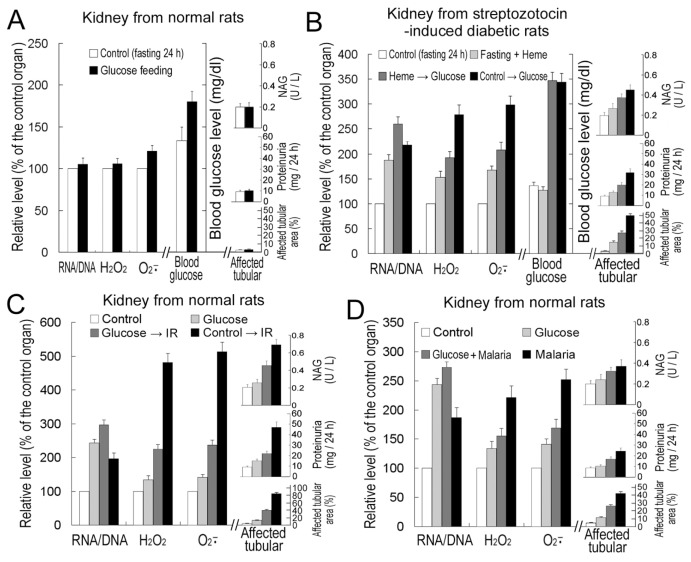
Figure 5.
The role of RNA amplification in diabetes/IR/malaria-induced oxidative stress resistance of rat kidney cells. Kidney RNA/DNA ratio, H2O2 and superoxide levels and tubular damages (tubular dilation area [Figure SM-4], proteinuria level and N-acetyl-β glucosaminidase [NAG] level) and blood glucose levels in normal (A, C, D) and diabetic rats (B) were determined. The rat (fasted for 24 h for the “control” sample to diabetic experiments) kidneys were treated with or without 1 mmol/L heme or 30% glucose (renal arterial infusion), and then 30% glucose solution (every 8 h, 3× total) was administered orally or IR or malaria infection was performed. Samples were taken at 24 h after IR or glucose administration, or 8 d after malaria infection. The sample “glucose” means four times glucose infusion (every 2 d) without malaria infection. See “Materials and Methods” for details. Data in control samples are normalized to 100%. Error bars show standard deviations (n = 3).

