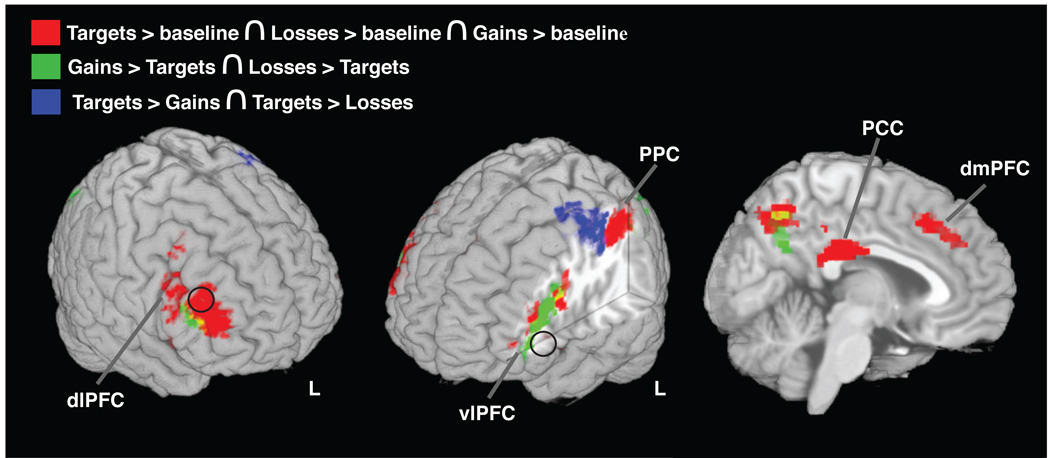
Figure 2. Dissociating activations to targets, gains, and losses.
Shown are conjunctions and contrasts of neural activations to targets and monetary trials. In red are neural regions activated by targets, gains, and losses (conjunction of activations to targets, gains, and losses). In green are regions where monetary trials produced greater activation than targets (intersect of gains > targets and losses > targets). In blue are regions where targets produced greater activations than monetary trials (intersect of targets > losses and targets > gains). Black circles designate the locations of the ROIs derived from Yamasaki and colleagues (see text for details).

