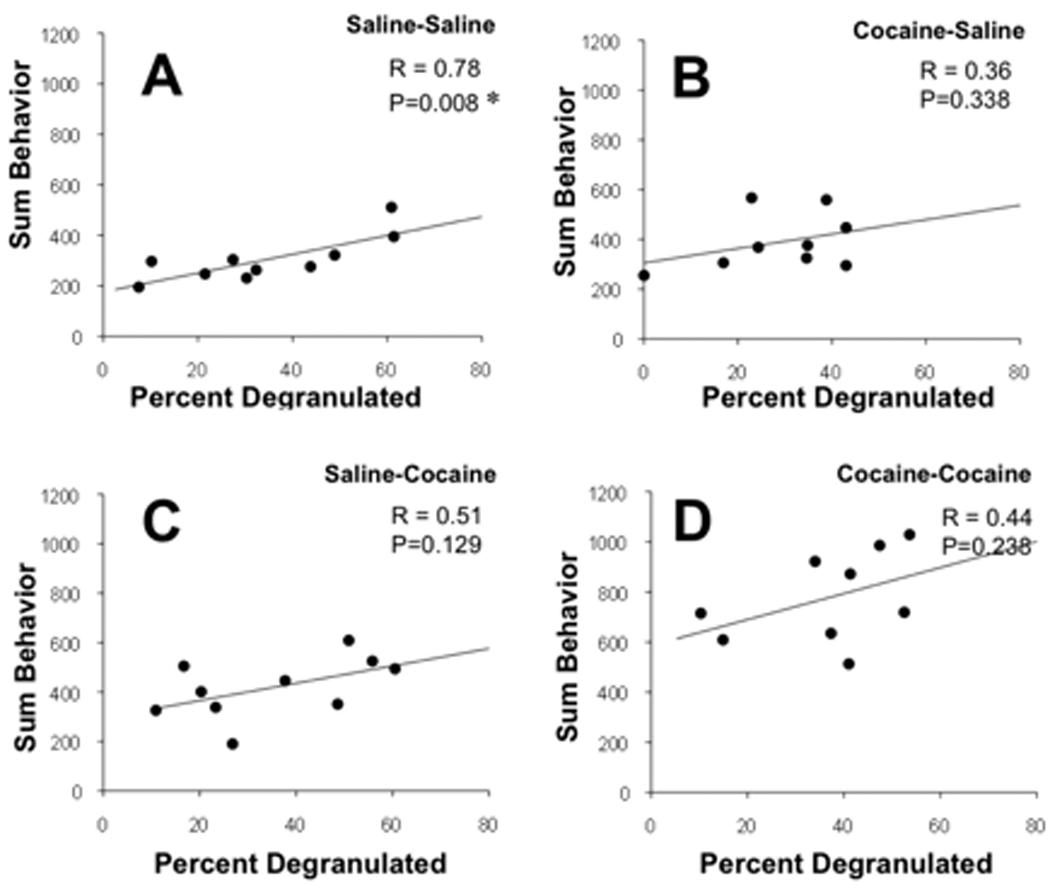
Figure 3.

Correlations between the percent of meningeal mast cells that are degranulated and locomotor activity of mice after saline or cocaine treatment. The four treatment groups are designated at the top of each panel where the first treatment listed reflects the chronic daily injection schedule (5 consecutive days with 15 mg/kg of cocaine or saline) and the second reflects the acute challenge delivered 11 days later and just 60 min before death. Behavior was recorded for 60 min after the injections. Activity is shown as the average sum of behaviors during the entire 60 min episode after injections. The correlation coefficient (R) for each set of data and the probability that the correlation is significant (P) are indicated on each panel. P < 0.05 is taken as statistically significant and indicated by an asterisk.
