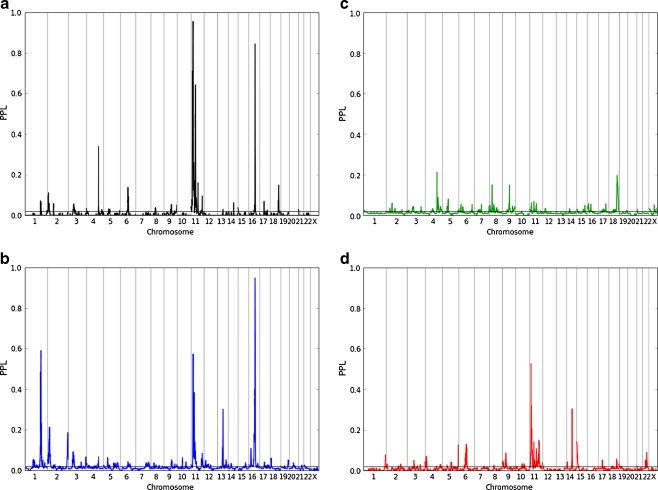
Fig. 1.
Genome-wide linkage analyses in a omnibus, b LIQ, c MIQ, and d NIQ groups. The PPL (posterior probability of linkage) represents the probability of an ASD gene at each position. The x-axis represents chromosomes 1–23 (X) on the Kosambi cM scale; the y-axis is on the probability scale. The horizontal line at PPL = 0.02 corresponds to the prior probability of linkage. Values below this line represent evidence against linkage, while values above the line represent evidence for linkage, at the given position

