
Figure 2.
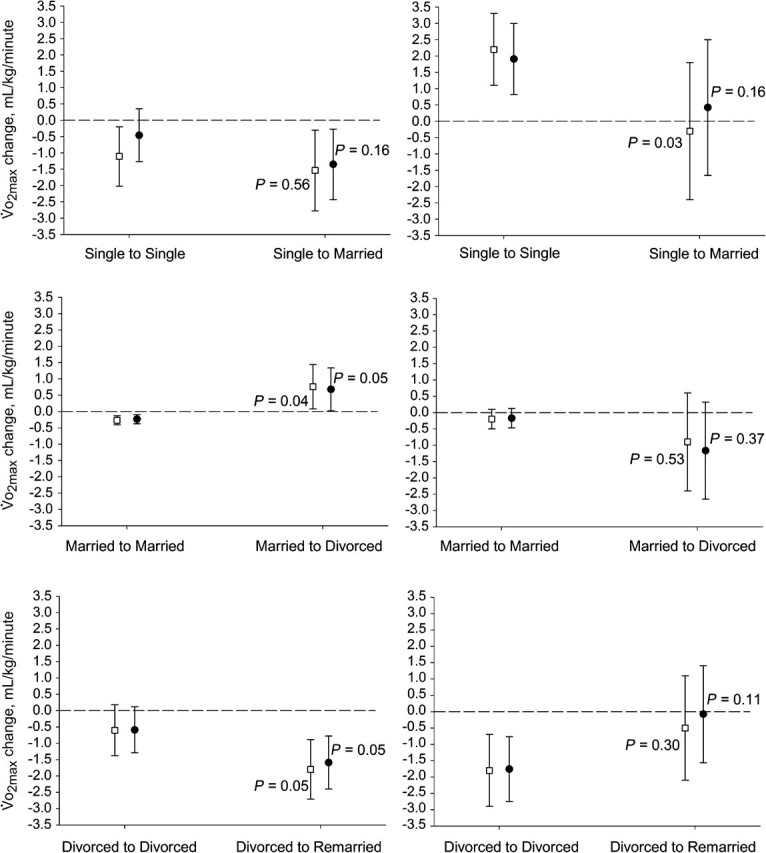
Changes in fitness (follow-up minus baseline) according to marital status transitions in men (left) and women (right) after adjustment for confounders, Dallas, Texas, 1987–2005. The P values represent intergroup differences in the mean changes observed (e.g., participants getting married vs. those remaining single). The dashed line represents the “no change” line (value 0). The white squares represent mean change (and 95% confidence intervals) after adjustment for age, examination year, follow-up and baseline  O2max, physical activity, and body mass index. The black circles represent mean change after adjustment for age, examination year, follow-up and baseline O2max, and changes in physical activity and body mass index. O2max, maximal oxygen consumption.