Abstract
The ultimate goal of most shotgun proteomic pipelines is the discovery of novel biomarkers to direct the development of quantitative diagnostics for the detection and treatment of disease. Differential comparisons of biological samples identify candidate peptides that can serve as proxys of candidate proteins. While these discovery approaches are robust and fairly comprehensive, they have relatively low throughput. When merged with targeted mass spectrometry, this pipeline can fuel hypothesis-driven studies and the development of novel diagnostics and therapeutics.
Keywords: quantitative shotgun proteomics, biomarker discovery, targeted mass spectrometry, human tissue
INTRODUCTION
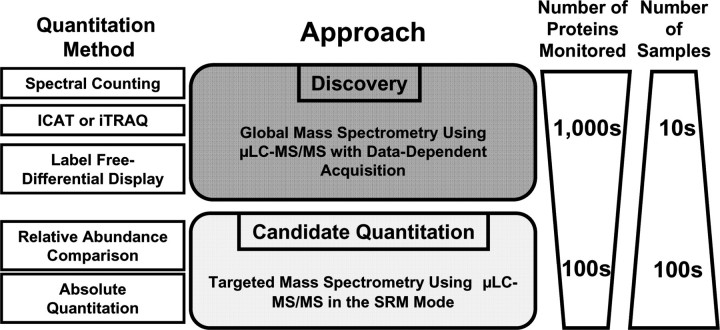
A common goal of most shotgun proteomic studies is the discovery of novel biomarkers of disease. However, discovery alone is insufficient and proteomic pipelines that streamline the process from discovery to diagnostics are beginning to take shape. This review will focus on several robust quantitative strategies that fuel the merger of discovery and hypothesis-driven shotgun proteomics as it applies to the analysis of human samples. As illustrated in Figure 1, biological samples are first compared using various quantitative platforms [e.g. spectral count comparisons, chemical derivatizations and label-free differential mass spectrometry (MS)]. These discovery approaches serve to identify differentially expressed peptides which may represent candidate biomarkers of disease and/or lead to enhanced insight in the molecular mechanisms of disease. While these discovery approaches are robust and can monitor thousands of proteins in each analysis, they have relatively low throughput. When merged with targeted MS, capable of monitoring hundreds of proteins with high-throughput capacity, this pipeline can serve to drive hypothesis-driven studies, critical for the development of quantitative assays and novel diagnostics and therapeutics.
Figure 1:
Overview of discovery and candidate quantitation approaches.
DISCOVERY-DRIVEN SHOTGUN PROTEOMICS
Shotgun proteomic platforms provide robust alternatives to gel-based approaches for the quantitative analysis of complex protein samples. Because the analyses are performed at the peptide level, the biochemical heterogeneity of intact proteins is dramatically reduced [1]. A popular example of a shotgun proteomic platform is MudPIT (Multi-dimensional Protein Identification Technology), which uses biphasic microcapillary columns typically packed with both strong cation exchange (SCX) and reverse phase (RP) material to resolve protein mixtures that have been digested and loaded directly onto the column [1–4]. The solid phase column packing material allows for the separation of peptides based on both charge and hydrophobicity. The column is then placed inline with a tandem mass spectrometer to facilitate electrospray ionization (ESI) followed by mass analysis of the ions as they are eluted off the column using alternating salt pulses and organic mobile gradients. MudPIT allows for the identification of proteins with variable pI, molecular weight and hydrophobicity, making this method largely unbiased.
SPECTRAL COUNTING
A simple differential measure of relative protein abundance known as ‘spectral counting’ is commonly used in conjunction with MudPIT analyses (Figure 2). The total number of spectra that identify peptides originating from a given protein shows good linear correlation with the abundance of that protein [5–7]. This observation allows for relative quantitative comparisons of protein levels between samples by summing all the MS/MS spectral observations for all peptides of a given protein, including spectra from the same peptide at multiple charge states. The major analytical caveat to using this approach is that spectral count ratios can be biased by protein size, peptide length and other peptide physiochemical properties that affect MS detection. Therefore, appropriate statistical analyses should be considered [8, 9].
Figure 2:
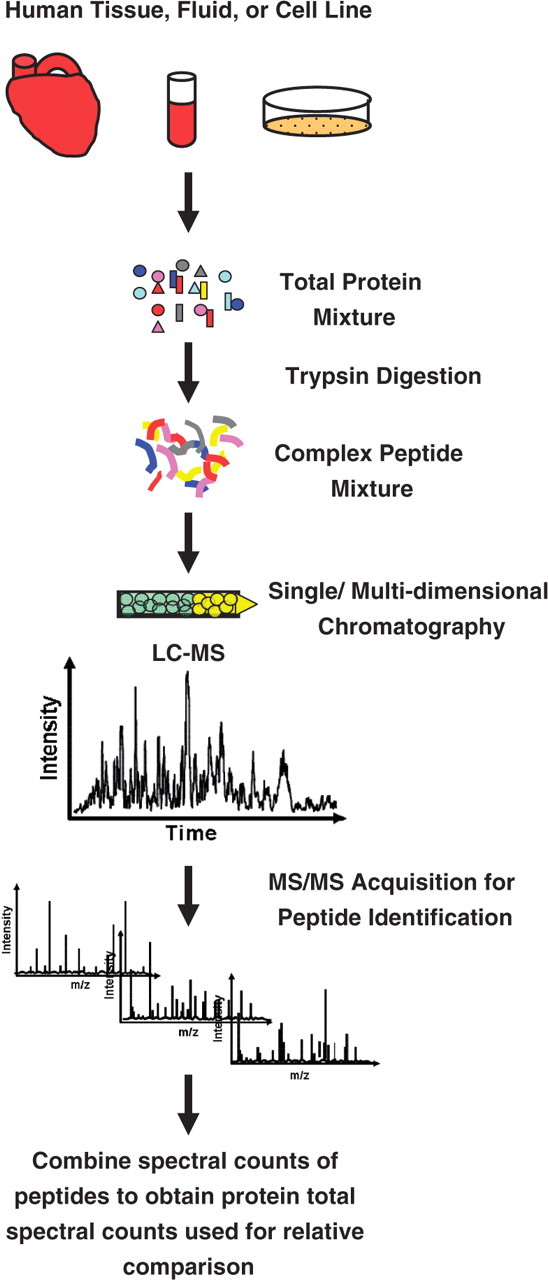
Differential protein comparison using spectral count. A complex human sample is digested, chromatographically separated and analyzed using MS/MS. Following peptide identification, spectral counts of all the peptides in a given protein are combined to yield a measure of relative protein abundance.
Spectral counting has shown high utility for simple (tandem affinity purified complexes) and moderately complex samples (such as fractionated tissues and yeast lysates) [7, 10, 11]. However, when analyzing extremely complex samples (such as unfractionated human tissue), the low overlap of protein identifications that is observed between samples can significantly limit the depth of quantitative coverage. A study by Kline et al. [12] reported only 51% overlap in protein identifications from the analysis of total unfractionated protein from human cardiac explants. Though this study was practically limited in depth of relative comparisons between samples, it illustrated the use of spectral counts as a metric for peptides that are detectable within a particular biological matrix or sample. Indeed, a list of proteotypic peptides (defined as peptides that are most representative and most likely to be observed for a protein of interest in a particular biological matrix) was generated in this study, and 98.3% of the peptides identified with high spectral counts (>200 spectra) had calculated observation frequencies >0.5 (i.e. the peptide was identified in at least 50% of the MS runs where the corresponding protein was identified). Databases such as these provide a valuable resource for the selection of peptides which may serve as quantitative proxys, representative for proteins of interest in a targeted MS analysis (further discussed in ‘Targeted MS’ section).
The ability to accurately quantify proteins in an extremely complex mixture by spectral counting largely depends on the number of spectra obtained and the coverage of sampling. This presents a large obstacle for those proteins present at low abundance, such as integral membrane proteins, which may never be selected for data-dependent acquisition due to limitations associated with depth of sampling of complex mixtures. A common solution to these limitations is sample fractionation to reduce complexity and increase the depth of sampling in MudPIT experiments. However, fractionation increases the overall number of samples to be analyzed and compared, drastically increasing the amount of MS time required. Furthermore, comprehensive coverage by MudPIT analyses of unfractionated complex samples typically requires multiple technical replicates from each sample to achieve saturation of unique protein identifications and obtain good statistical analyses for spectral count comparisons [12]. This requires significant commitments of instrument and data processing time. Furthermore, sample fractionation requires significant amounts of starting material, which is often incompatible with human samples and thereby limits the practical utility of spectral counting for human studies.
STABLE ISOTOPE LABELING STRATEGIES
A common strategy to increase the quantitative precision of a proteomic analysis is the incorporation of stable isotope-labeled internal standards. There are two general approaches to incorporate stable isotopes into proteins, metabolic labeling and chemical derivatization. The method of stable isotope metabolic labeling has successfully been used in both cell culture and mammals [13–15]. However, given the practical limitations of this approach in the analysis of human samples, it will not be discussed further in this review. Chemical derivatization platforms utilize various isotopically labeled tags or reagents (Review available [16]) [17–20]. Two popular tagging methods are discussed below.
In the ICAT (isotope-coded affinity tag) method, proteins from two different biological samples are labeled with either an isotopically ‘heavy’ (typically deuterium or 13C) or isotopically ‘light’ (native) ethylene glycol linker with a biotin affinity tag and a thiol-specific reactive group that selectively couples to the side chain of a reduced cysteine residues (Figure 3) [19]. Following covalent modification of all the cysteine residues in the samples with either a ‘heavy’ or ‘light’ isotope tag, the samples are mixed together, digested with protease and incubated on an avidin column to allow for enrichment of labeled peptides by the biotin moiety located on the isotope tag [21]. Following MS analysis, the relative abundance of peptides is determined by the ratio of the signal intensities from the ‘heavy’ and ‘light’ forms of each peptide. Individual peptide ratios from the same protein are then combined to produce abundance ratios of identified proteins in the sample. A major advantage of this tagging system is that it facilitates the enrichment of the modified peptides via affinity purification of the biotin moiety, thereby enhancing the detection of low-abundance proteins. However, because ICAT reagents selectively label proteins/peptides containing cysteine residues, those proteins which do not contain a cysteine residue will not be quantified using this method.
Figure 3:
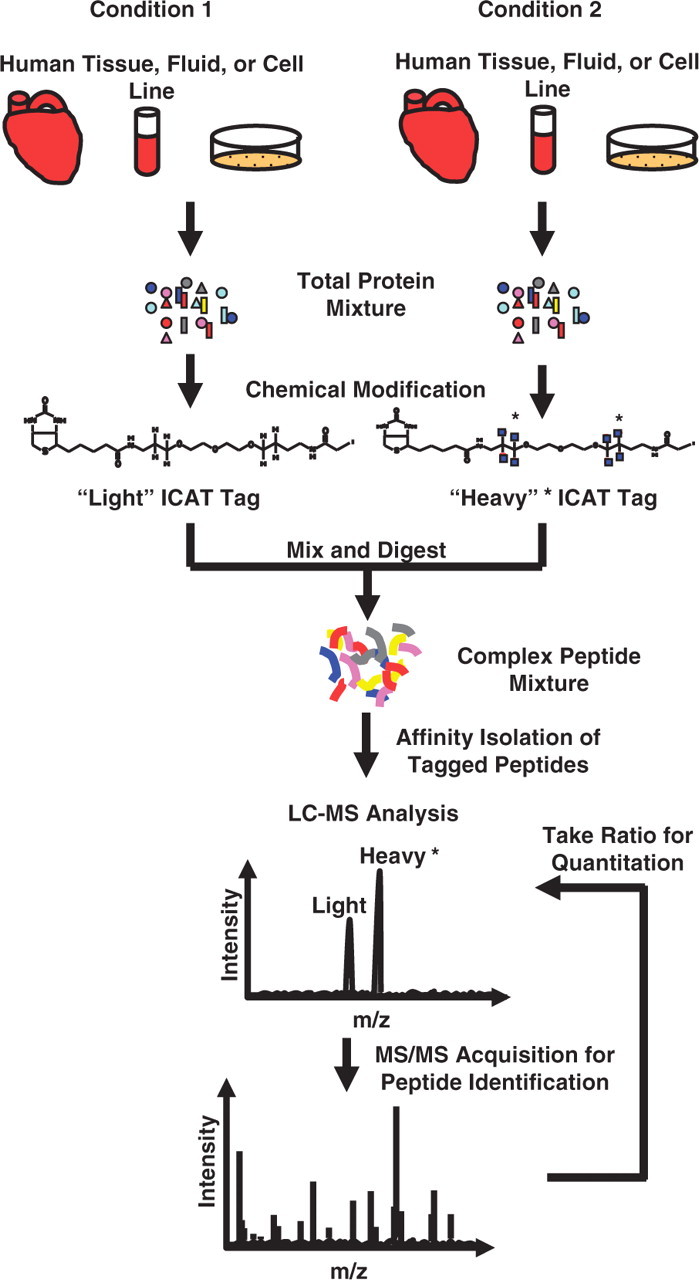
Peptide quantitation using ICAT. Samples are compared by differentially labeling the cysteine residues in the proteins with a ‘light’ or ‘heavy’ ICAT tag. The two protein groups are combined, digested and tagged peptides are affinity enriched and analyzed by LC-MS. Ratios of the ‘light’ and ‘heavy’ extracted ion chromatograms provide relative abundance of each tagged peptide.
More recently, the iTRAQ method was developed, which solved some of the limitations of ICAT. The iTRAQ method uses amine-specific isobaric reagents to label the primary amines of peptides for the concurrent quantitative comparison of up to eight different biological samples (Figure 4) [22, 23]. Labeled peptides from the different samples are mixed together to collectively undergo mass analysis. The MS spectrum of each peptide in the sample does not increase in complexity due to the isobaric nature of the tagging reagents, as compared to the ICAT method which results in multiple MS peaks per peptide. During peptide fragmentation, the isobaric amine groups are also fragmented to release reporter ions with distinct m/z's (e.g. 114.1, 115.1, 116.1 and 117.1 in the 4-plex reaction shown in Figure 4). Relative peptide abundance measurements between the four samples are then made based on the relative intensity of each reporter ion. Similar to the ICAT method, multiple peptide measurements can then be combined to result in relative abundance measurements at the protein level. The iTRAQ method has recently been used to monitor small molecule binding to proteins and map drug-induced changes in protein phosphorylation states in human cells, illustrating this method's potential use in drug discovery experiments [24]. However, although iTRAQ labeling allows for incorporation of labels into all peptides in a mixture (in contrast to ICAT), this inclusive feature inherently requires that the labeling be done after protease digestion, thereby limiting their use as internal standards because experimental variations at prior sample preparation steps are not accounted for.
Figure 4:
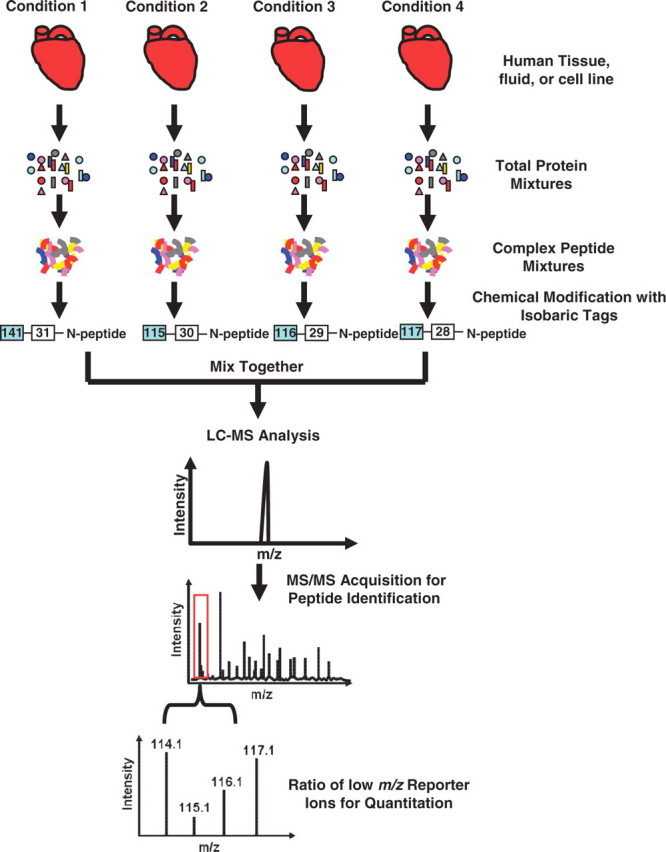
Peptide quantitation using iTRAQ. Digested protein samples are modified with isobaric tags on the N-terminus of all peptides. All tagged peptide groups are mixed together and undergo LC-MS/MS analysis. After fragmentation and peptide identification, the low mass region of the MS/MS spectrum displays the reporter ions produced by the fragmentation of the isobaric reporter tag. The ratio of reporter ions in the MS/MS spectrum provides relative abundance of the peptide in each biological sample.
DIFFERENTIAL MS QUANTITATION
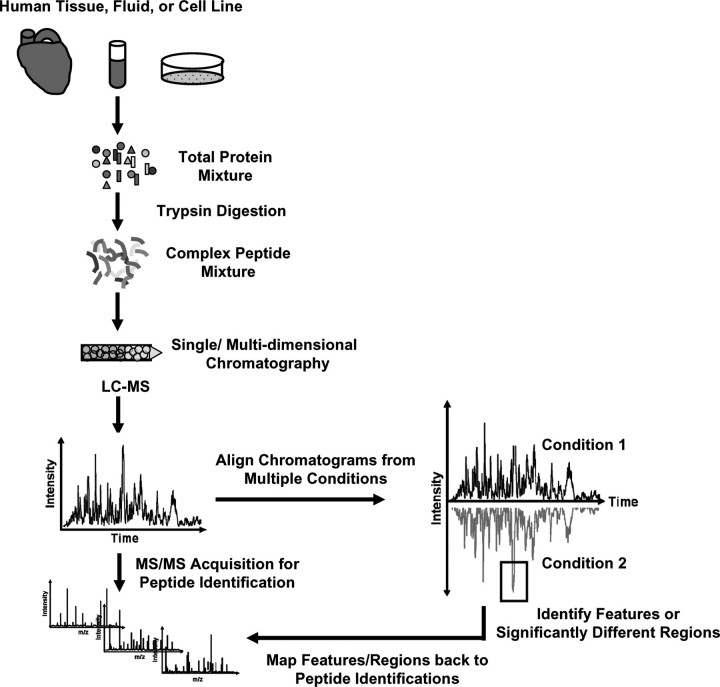
Recently, label-free approaches (collectively referred to as differential MS or dMS) have been developed, which utilize computational methods to find differences in the intensity of peptides in the MS signals, rather than the total number of MS/MS spectra that were stochastically sampled. These approaches rely on the comparison of distinct regions of m/z and retention time which represent the same analyte across multiple analyses, and are based on the concept of comparing samples via MS ‘images’ to detect feature differences after computational processing. In general, these computational methods can be divided into two groups. In the first group, spectral features (typically isotopic clusters indicating a peptide) are detected first and then statistically compared [25–29]. Alternatively, the second group applies statistics first so that only differential features are detected from the extracted ion chromatograms [30–33]. Both computational methods rely on the ability to chromatographically align multiple LC-MS runs from different samples, identify differences between the samples and determine the magnitude of the change (Figure 5). The absence of internal standards requires the careful use of experimental and computational methods to normalize and correct experimental variances which affect retention time and MS intensity.
Figure 5:
Relative quantitation using dMS. Samples are digested and chromatographically separated. Samples are then sequentially analyzed using LC-MS/MS. The collected data are then chromatographically aligned to allow for peak or feature identification that differ between the samples. Differential features are then mapped back to MS/MS spectra to obtain peptide identifications.
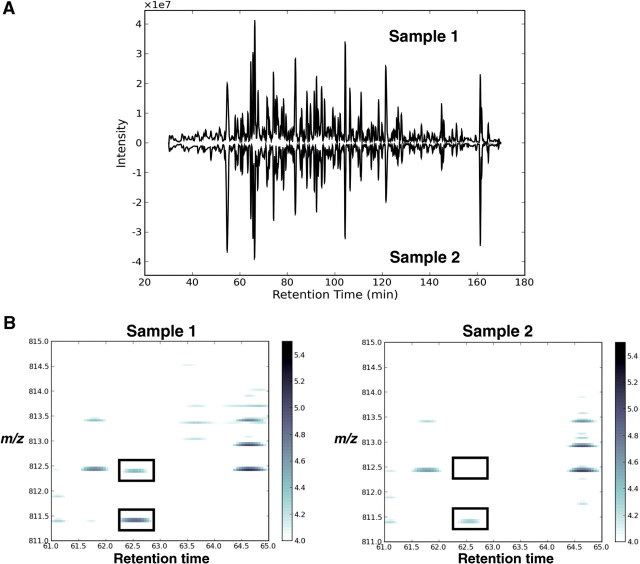
Regardless of the approach used, chromatographic alignment is an essential component to dMS analyses and also minimizes the chromatographic error so that signals measured at a given time and m/z in the mass spectrometer from different runs can be assumed to originate from the same molecular species. This can be addressed computationally by two classes of algorithms. The first class uses full scan MS data to ‘align’ the retention times of one run to another. This alignment is performed by algorithms such as dynamic time warping or correlation optimized warping which find an optimal mapping of retention times between runs that maximizes their similarity [34–36]. The second class matches detected features (such as peptide isotope distributions or MS/MS spectra) between runs, and applies algorithms such as regression to fit a time correction function to the matched markers [29, 37, 38]. Additionally, variations in signal intensity can be addressed by normalization. Callister et al. [39] assessed multiple normalization techniques for the label-free analysis of LC-FTMS data, and Wang et al. [40] use global normalization ratios while adjusting for low-intensity signals missing in some runs. Methods for the statistical discovery of differences in label-free MS data have been reviewed recently [41, 42]. The identification of peptide isotope distributions, or regions of m/z and RT, which significantly differ between samples have been implemented in numerous software packages, and summarized in multiple reviews [42–44]. Figure 6A shows an example of base peak chromatograms from two human heart biopsy samples following chromatographic alignment and normalization. Differences are then detected by comparing peptide maps of two mean, aligned human samples based on their m/z intensities and chromatographic retention time (obvious visual differences highlighted by black boxes in Figure 6B).
Figure 6:
Finding differences between human heart tissue samples using dMS. (A) Acquired chromatograms are computationally aligned and normalized, and feature differences are identified. (B) Peptide maps can be plotted as 2D images following chromatographic alignment and normalization. Regions of m/z and retention time that have a difference in abundance between the samples can then be identified (as illustrated by black boxes).
Importantly, label-free MS quantitation requires reproducible sample preparation and chromatographic separations, which can be difficult when working with extremely complex samples such as human tissues. Also, because differences between samples are identified from the MS scans, the mapping of differentially expressed features to peptide identifications continues to be limited by the scan speed of the mass analyzer, causing only a fraction of identified features to be mapped back to peptide identifications by MS/MS. To by-pass this obstacle, ‘inclusion’ lists can be generated to modify subsequent data-dependant MS/MS analyses to focus instrument time on the identification of previously unidentified ions that gave rise to significant differences [45].
Universal to all the quantitative platforms described above is the preferential identification of high-abundance proteins in a complex sample, with lower sampling of low-abundance protein species. In the case of the isotope tagging strategies, quantitative information is further restricted to peptides that contain the chemical derivatization. While many differentially expressed features or regions may be identified using dMS, only a subset of those may be linked to peptide identifications by MS/MS. For the analysis of highly complex samples, such as unfractionated human tissue, these techniques are invaluable for discovering differentially expressed peptides (protein candidates), but remain limited in utility for the targeted quantitation of peptides (especially those derived from proteins of low abundance) in a high-throughput manner.
TARGETED MS
The necessity for highly sensitive and selective detection strategies for analytes in complex human samples was recognized early by researchers interested in the detection of small molecule analytes, such as drug metabolites and hormones. In fact, the development of selective reaction monitoring (SRM) was largely pioneered by those interested in detecting these types of compounds in highly complex and typically unfractionated samples [46–51]. The use of SRM for the robust detection of a multitude of compounds has been reported in human plasma [49, 52–54] and other complex human samples [55, 56]. Indeed, the use of isotope-labeled internal standards using SRM is well established for the robust and high-throughput analysis of metabolites in complex human samples. Only more recently has the proteomics field begun using the SRM technique as a selective way to detect and quantitatively monitor unique peptides from proteins of interest [57–60]. This shift in proteomics to targeted MS methods was largely based upon the difficulty in the detection of low-abundance proteins within the context of unfractionated complex samples such as human tissue and plasma. In fact, the accurate quantitation of peptides and proteins in human plasma is incredibly challenging due to the extreme dynamic range of ∼108 [61]. Furthermore, monitoring low-abundance proteins in human tissue biopsies, such as the heart, which combines the complexity of a heterogeneous tissue with blood contamination, can be a daunting task.
Targeted MS (LC-MS/MS in the SRM mode) approaches require prior knowledge of the analyte to be detected. However, when coupled with the discovery methods described above, targeted MS provides the sensitivity, selectivity and throughput required for the analysis of human clinical samples. Most targeted MS techniques utilize the discriminating power of quadrupole mass analyzers to select specific peptides in a complex sample mixture for detection. Peptide SRM uses ESI followed by two phases of mass selection. The first phase (in Q1) selects for the m/z of the precursor ion (charged unique peptide). Following fragmentation of the selected peptide by collision induced dissociation (CID in q2), the second phase (in Q3) selects for the m/z of fragment ion derived from the precursor ion (Figure 7).
Figure 7:
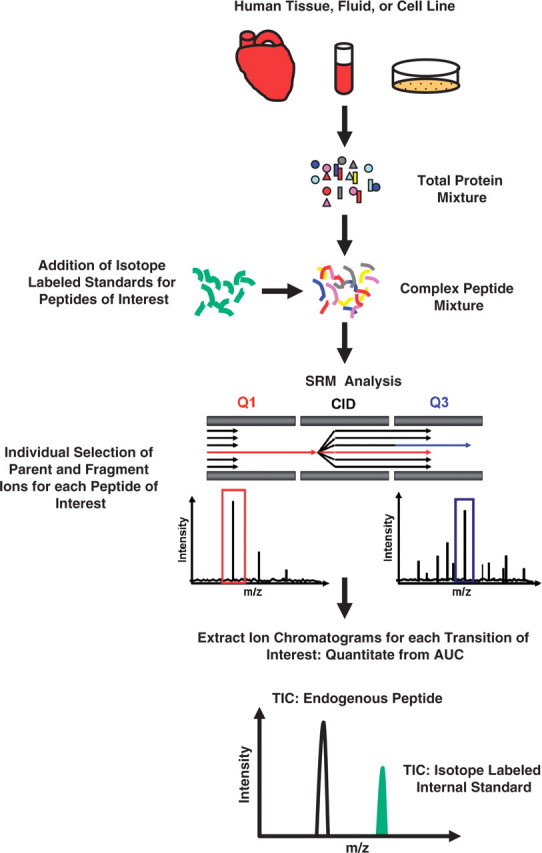
Peptide quantitation using LC-MS/MS in the SRM mode. Samples are digested and isotope-labeled peptide standards corresponding to unique peptides of interest are added. Both endogenous and isotope-labeled peptides are then selected for analysis using a triple-quadrupole mass spectrometer. The m/z of the precursor ions are selected in Q1, and the m/z of the fragment ions are selected in Q3. The extracted ion chromatograms are then used for absolute quantitation of the peptide.
The use of two mass filters in the triple quadrupole allows for the peptide analyte to be selectively detected, even if it is present in very low abundance in an unfractionated complex mixture. This level of mass selection increases sensitivity by only allowing the transmission of a small population of ions, thus minimizing chemical background noise [62]. Additionally, SRM measurements are easily multiplexed [63], due to the rapid duty cycle of current instrumentation (10–100 ms), facilitating hundreds of peptides to be monitored on a chromatographic time scale in a single MS run. Because SRM assays are typically optimized for peptides separated using single phase chromatography, analyses are high-throughput and rapid with minimal sample consumption (0.5–5 μg peptides/analysis) and therefore, well suited to accommodate the large sample numbers of clinical studies.
SRM data analysis involves the comparison of the area under the curve (AUC) from extracted ion chromatograms for each transition monitored. Relative changes between multiple samples can be made without the inclusion of internal standards. However, the incorporation of stable isotope-labeled internal standards allows for high precision quantitation of each unique peptide [57, 59, 60, 64]. Because the amount of internal standard peptide is known and calibrated for the linear quantitative range, the ratio between the areas under the extracted ion chromatograms of endogenous peptide and isotope-labeled peptide allows for the calculation of the absolute amount of the endogenous peptide [57]. Quantitation of proteins using this method is based on the detection of one or more peptides from that protein [65]. In contrast to global MS quantitation methods, targeted MS requires prior knowledge of the peptides (proteins) selected for quantitation. This distinction, along with the throughput and sensitivity, makes it ideal for hypothesis-driven queries, and for the verification and validation of those protein candidates identified using global MS analyses.
However, obstacles may arise due to the fact that specific unique peptides are used as quantitative proxys for the protein from which they are cleaved to yield a measure of the protein abundance. While this can be advantageous in many ways because it allows for separate detection and quantitation of multiple peptides from a single protein to provide information concerning protein abundance, or even potentially varied modification states [57, 64], it can also be limiting if the detection of multiple peptides is difficult and/or modified peptide isoforms are below the limits of detection or quantitation within the given sample matrix. While the most comprehensive read out of protein abundance and state is achieved by the detection of multiple peptides per protein, working with an unfractionated complex sample can make this extremely difficult. This challenge becomes particularly apparent due to the shortened single dimension (RP) chromatographic separation that is used for SRM measurements, which causes all peptide components to be eluted over a short time window. Massive peptide co-elution can cause significant ion suppression and decreased signal of the peptide of interest. The phenomena of ion suppression has been extensively studied by the small molecules field, but its impact on peptide detection using SRM has been less characterized [66, 67]. What is clear is that significant optimization of the chromatography may be necessary for the ideal detection and quantitation of each unique peptide from candidate proteins of interest.
CONCLUSION
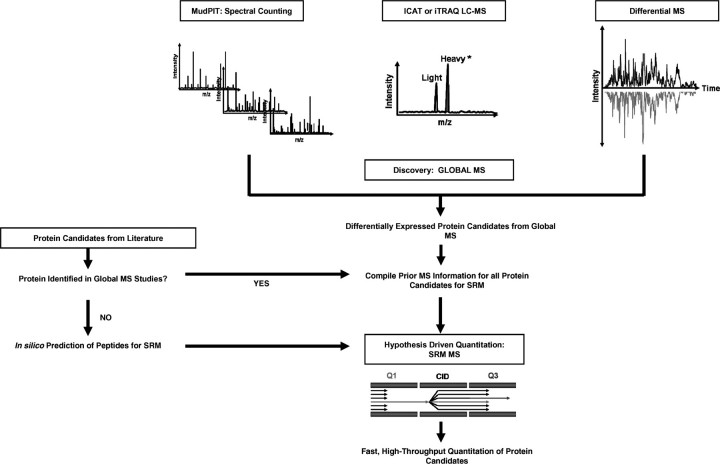
The proteomics field has recognized the need for quantitative methods that are compatible with the analysis of complex biological samples, particularly human samples such as tissue and plasma. However, proteomic analysis of unfractionated complex human samples is difficult due to the large dynamic range of protein expression. Currently there are a number of robust discovery platforms that are used in the field to identify differentially expressed proteins in human samples, either utilizing isotope-tags or label-free methods. When merged with targeted MS platforms, capable of monitoring hundreds of proteins with high-throughput capacity, this pipeline (illustrated in Figure 8) can serve to drive hypothesis-driven studies, critical for the development of novel diagnostics and therapeutics.
Figure 8:
Merger of discovery and hypothesis-driven shotgun proteomics. Global MS quantitation strategies such as spectral counting, ICAT, iTRAQ and dMS can be used to discover differentially expressed protein candidates. These, combined with protein candidates from literature, can provide candidate target protein lists for hypothesis-driven high-throughput quantitative studies.
Key Points.
Major quantitative shotgun proteomic strategies for discovery are summarized.
Targeted proteomics using LC-MS/MS in the SRM mode is discussed.
An experimental pipeline merging discovery and targeted analyses is proposed for high-throughput clinical studies.
Biographies
Kelli Kline is a predoctoral NRSA fellow in the Wu laboratory, and her thesis is focused on the development of targeted proteomic analyses for the analysis of unfractionated human cardiac biopsies.
Greg L. Finney is a predoctoral student in the Department of Genome Sciences, University of Washington, Seattle, WA, USA.
Christine Wu is an assistant professor of pharmacology at the University of Colorado School of Medicine.
References
- McCormack AL, Schieltz DM, Goode B, et al. Direct analysis and identification of proteins in mixtures by LC/MS/MS and database searching at the low-femtomole level. Anal Chem. 1997;69:767–76. doi: 10.1021/ac960799q. [DOI] [PubMed] [Google Scholar]
- Link AJ, Eng J, Schieltz DM, et al. Direct analysis of protein complexes using mass spectrometry. Nat Biotechnol. 1999;17:676–82. doi: 10.1038/10890. [DOI] [PubMed] [Google Scholar]
- Peng J, Gygi SP. Proteomics: the move to mixtures. J Mass Spectrom. 2001;36:1083–91. doi: 10.1002/jms.229. [DOI] [PubMed] [Google Scholar]
- Washburn MP, Wolters D, Yates JR., 3rd Large-scale analysis of the yeast proteome by multidimensional protein identification technology. Nat Biotechnol. 2001;19:242–7. doi: 10.1038/85686. [DOI] [PubMed] [Google Scholar]
- Gao J, Friedrichs MS, Dongre AR, Opiteck GJ. Guidelines for the routine application of the peptide hits technique. J Am Soc Mass Spectrom. 2005;16:1231–8. doi: 10.1016/j.jasms.2004.12.002. [DOI] [PubMed] [Google Scholar]
- Liu H, Sadygov RG, Yates JR., 3rd A model for random sampling and estimation of relative protein abundance in shotgun proteomics. Anal Chem. 2004;76:4193–201. doi: 10.1021/ac0498563. [DOI] [PubMed] [Google Scholar]
- Zybailov B, Coleman MK, Florens L, Washburn MP. Correlation of relative abundance ratios derived from peptide ion chromatograms and spectrum counting for quantitative proteomic analysis using stable isotope labeling. Anal Chem. 2005;77:6218–24. doi: 10.1021/ac050846r. [DOI] [PubMed] [Google Scholar]
- Zybailov B, Mosley AL, Sardiu ME, et al. Statistical analysis of membrane proteome expression changes in Saccharomyces cerevisiae. J Proteome Res. 2006;5:2339–47. doi: 10.1021/pr060161n. [DOI] [PubMed] [Google Scholar]
- Braisted JC, Kuntumalla S, Vogel C, et al. The APEX Quantitative Proteomics Tool: generating protein quantitation estimates from LC-MS/MS proteomics results. BMC Bioinformatics. 2008;9:529. doi: 10.1186/1471-2105-9-529. [DOI] [PMC free article] [PubMed] [Google Scholar]
- Gilchrist A, Au CE, Hiding J, et al. Quantitative proteomics analysis of the secretory pathway. Cell. 2006;127:1265–81. doi: 10.1016/j.cell.2006.10.036. [DOI] [PubMed] [Google Scholar]
- Carvalho PC, Hewel J, Barbosa VC, Yates JR., 3rd Identifying differences in protein expression levels by spectral counting and feature selection. Genet Mol Res. 2008;7:342–56. doi: 10.4238/vol7-2gmr426. [DOI] [PMC free article] [PubMed] [Google Scholar]
- Kline KG, Frewen B, Bristow MR, et al. High quality catalog of proteotypic peptides from human heart. J Proteome Res. 2008;7:5055–61. doi: 10.1021/pr800239e. [DOI] [PMC free article] [PubMed] [Google Scholar]
- Ong SE, Blagoev B, Kratchmarova I, et al. Stable isotope labeling by amino acids in cell culture, SILAC, as a simple and accurate approach to expression proteomics. Mol Cell Proteomics. 2002;1:376–86. doi: 10.1074/mcp.m200025-mcp200. [DOI] [PubMed] [Google Scholar]
- Wu CC, MacCoss MJ, Howell KE, et al. Metabolic labeling of mammalian organisms with stable isotopes for quantitative proteomic analysis. Anal Chem. 2004;76:4951–9. doi: 10.1021/ac049208j. [DOI] [PubMed] [Google Scholar]
- Oda Y, Huang K, Cross FR, et al. Accurate quantitation of protein expression and site-specific phosphorylation. Proc Natl Acad Sci USA. 1999;96:6591–6. doi: 10.1073/pnas.96.12.6591. [DOI] [PMC free article] [PubMed] [Google Scholar]
- Chen X, Sun L, Yu Y, et al. Amino acid-coded tagging approaches in quantitative proteomics. Expert Rev Proteomics. 2007;4:25–37. doi: 10.1586/14789450.4.1.25. [DOI] [PubMed] [Google Scholar]
- Cagney G, Emili A. De novo peptide sequencing and quantitative profiling of complex protein mixtures using mass-coded abundance tagging. Nat Biotechnol. 2002;20:163–70. doi: 10.1038/nbt0202-163. [DOI] [PubMed] [Google Scholar]
- Conrads TP, Alving K, Veenstra TD, et al. Quantitative analysis of bacterial and mammalian proteomes using a combination of cysteine affinity tags and 15N-metabolic labeling. Anal Chem. 2001;73:2132–9. doi: 10.1021/ac001487x. [DOI] [PubMed] [Google Scholar]
- Gygi SP, Rist B, Gerber SA, et al. Quantitative analysis of complex protein mixtures using isotope-coded affinity tags. Nat Biotechnol. 1999;17:994–9. doi: 10.1038/13690. [DOI] [PubMed] [Google Scholar]
- Yao X, Freas A, Ramirez J, et al. Proteolytic 18O labeling for comparative proteomics: model studies with two serotypes of adenovirus. Anal Chem. 2001;73:2836–42. doi: 10.1021/ac001404c. [DOI] [PubMed] [Google Scholar]
- Smolka MB, Zhou H, Purkayastha S, Aebersold R. Optimization of the isotope-coded affinity tag-labeling procedure for quantitative proteome analysis. Anal Biochem. 2001;297:25–31. doi: 10.1006/abio.2001.5318. [DOI] [PubMed] [Google Scholar]
- Choe L, D’Ascenzo M, Relkin NR, et al. 8-plex quantitation of changes in cerebrospinal fluid protein expression in subjects undergoing intravenous immunoglobulin treatment for Alzheimer's disease. Proteomics. 2007;7:3651–60. doi: 10.1002/pmic.200700316. [DOI] [PMC free article] [PubMed] [Google Scholar]
- Ross PL, Huang YN, Marchese JN, et al. Multiplexed protein quantitation in Saccharomyces cerevisiae using amine-reactive isobaric tagging reagents. Mol Cell Proteomics. 2004;3:1154–69. doi: 10.1074/mcp.M400129-MCP200. [DOI] [PubMed] [Google Scholar]
- Bantscheff M, Eberhard D, Abraham Y, et al. Quantitative chemical proteomics reveals mechanisms of action of clinical ABL kinase inhibitors. Nat Biotechnol. 2007;25:1035–44. doi: 10.1038/nbt1328. [DOI] [PubMed] [Google Scholar]
- Andreev VP, Li L, Cao L, et al. A new algorithm using cross-assignment for label-free quantitation with LC-LTQ-FT MS. J Proteome Res. 2007;6:2186–94. doi: 10.1021/pr0606880. [DOI] [PMC free article] [PubMed] [Google Scholar]
- Cox J, Mann M. MaxQuant enables high peptide identification rates, individualized p.p.b.-range mass accuracies and proteome-wide protein quantification. Nat Biotechnol. 2008;26:1367–72. doi: 10.1038/nbt.1511. [DOI] [PubMed] [Google Scholar]
- Fang R, Elias DA, Monroe ME, et al. Differential label-free quantitative proteomic analysis of Shewanella oneidensis cultured under aerobic and suboxic conditions by accurate mass and time tag approach. Mol Cell Proteomics. 2006;5:714–25. doi: 10.1074/mcp.M500301-MCP200. [DOI] [PubMed] [Google Scholar]
- Jaffe JD, Mani DR, Leptos KC, et al. PEPPeR, a platform for experimental proteomic pattern recognition. Mol Cell Proteomics. 2006;5:1927–41. doi: 10.1074/mcp.M600222-MCP200. [DOI] [PMC free article] [PubMed] [Google Scholar]
- Mueller LN, Rinner O, Schmidt A, et al. SuperHirn—a novel tool for high resolution LC-MS-based peptide/protein profiling. Proteomics. 2007;7:3470–80. doi: 10.1002/pmic.200700057. [DOI] [PubMed] [Google Scholar]
- Wiener MC, Sachs JR, Deyanova EG, Yates NA. Differential mass spectrometry: a label-free LC-MS method for finding significant differences in complex peptide and protein mixtures. Anal Chem. 2004;76:6085–96. doi: 10.1021/ac0493875. [DOI] [PubMed] [Google Scholar]
- Smith CA, Want EJ, O’Maille G, et al. XCMS: processing mass spectrometry data for metabolite profiling using nonlinear peak alignment, matching, and identification. Anal Chem. 2006;78:779–87. doi: 10.1021/ac051437y. [DOI] [PubMed] [Google Scholar]
- America AH, Cordewener JH, van Geffen MH, et al. Alignment and statistical difference analysis of complex peptide data sets generated by multidimensional LC-MS. Proteomics. 2006;6:641–53. doi: 10.1002/pmic.200500034. [DOI] [PubMed] [Google Scholar]
- Finney GL, Blackler AR, Hoopmann MR, et al. Label-free comparative analysis of proteomics mixtures using chromatographic alignment of high-resolution muLC-MS data. Anal Chem. 2008;80:961–71. doi: 10.1021/ac701649e. [DOI] [PubMed] [Google Scholar]
- Listgarten J, Neal RM, Roweis ST, et al. Difference detection in LC-MS data for protein biomarker discovery. Bioinformatics. 2007;23:e198–204. doi: 10.1093/bioinformatics/btl326. [DOI] [PubMed] [Google Scholar]
- Prakash A, Mallick P, Whiteaker J, et al. Signal maps for mass spectrometry-based comparative proteomics. Mol Cell Proteomics. 2006;5:423–32. doi: 10.1074/mcp.M500133-MCP200. [DOI] [PubMed] [Google Scholar]
- Prince JT, Marcotte EM. Chromatographic alignment of ESI-LC-MS proteomics data sets by ordered bijective interpolated warping. Anal Chem. 2006;78:6140–52. doi: 10.1021/ac0605344. [DOI] [PubMed] [Google Scholar]
- Lange E, Gropl C, Schulz-Trieglaff O, et al. A geometric approach for the alignment of liquid chromatography-mass spectrometry data. Bioinformatics. 2007;23:i273–81. doi: 10.1093/bioinformatics/btm209. [DOI] [PubMed] [Google Scholar]
- Fischer B, Grossmann J, Roth V, et al. Semi-supervised LC/MS alignment for differential proteomics. Bioinformatics. 2006;22:e132–40. doi: 10.1093/bioinformatics/btl219. [DOI] [PubMed] [Google Scholar]
- Callister SJ, Barry RC, Adkins JN, et al. Normalization approaches for removing systematic biases associated with mass spectrometry and label-free proteomics. J Proteome Res. 2006;5:277–86. doi: 10.1021/pr050300l. [DOI] [PMC free article] [PubMed] [Google Scholar]
- Wang P, Tang H, Zhang H, et al. Normalization regarding non-random missing values in high-throughput mass spectrometry data. Pac Symp Biocomput. 2006:315–26. [PubMed] [Google Scholar]
- Nie L, Wu G, Zhang W. Statistical application and challenges in global gel-free proteomic analysis by mass spectrometry. Crit Rev Biotechnol. 2008;28:297–307. doi: 10.1080/07388550802543158. [DOI] [PubMed] [Google Scholar]
- Wong JW, Sullivan MJ, Cagney G. Computational methods for the comparative quantification of proteins in label-free LCn-MS experiments. Brief Bioinform. 2008;9:156–65. doi: 10.1093/bib/bbm046. [DOI] [PubMed] [Google Scholar]
- Mueller LN, Brusniak MY, Mani DR, Aebersold R. An assessment of software solutions for the analysis of mass spectrometry based quantitative proteomics data. J Proteome Res. 2008;7:51–61. doi: 10.1021/pr700758r. [DOI] [PubMed] [Google Scholar]
- Vandenbogaert M, Li-Thiao-Te S, Kaltenbach HM, et al. Alignment of LC-MS images, with applications to biomarker discovery and protein identification. Proteomics. 2008;8:650–72. doi: 10.1002/pmic.200700791. [DOI] [PubMed] [Google Scholar]
- Schmidt A, Gehlenborg N, Bodenmiller B, et al. An integrated, directed mass spectrometric approach for in-depth characterization of complex peptide mixtures. Mol Cell Proteomics. 2008;7:2138–50. doi: 10.1074/mcp.M700498-MCP200. [DOI] [PMC free article] [PubMed] [Google Scholar]
- Anderson MA, Wachs T, Henion JD. Quantitative ionspray liquid chromatographic/tandem mass spectrometric determination of reserpine in equine plasma. J Mass Spectrom. 1997;32:152–8. doi: 10.1002/(SICI)1096-9888(199702)32:2<152::AID-JMS456>3.0.CO;2-W. [DOI] [PubMed] [Google Scholar]
- Barbarin N, Mawhinney DB, Black R, Henion J. High-throughput selected reaction monitoring liquid chromatography-mass spectrometry determination of methylphenidate and its major metabolite, ritalinic acid, in rat plasma employing monolithic columns. J Chromatogr B Analyt Technol Biomed Life Sci. 2003;783:73–83. doi: 10.1016/s1570-0232(02)00487-7. [DOI] [PubMed] [Google Scholar]
- Borges V, Yang E, Dunn J, Henion J. High-throughput liquid chromatography-tandem mass spectrometry determination of bupropion and its metabolites in human, mouse and rat plasma using a monolithic column. J Chromatogr B Analyt Technol Biomed Life Sci. 2004;804:277–87. doi: 10.1016/j.jchromb.2004.01.024. [DOI] [PubMed] [Google Scholar]
- Steinborner S, Henion J. Liquid-liquid extraction in the 96-well plate format with SRM LC/MS quantitative determination of methotrexate and its major metabolite in human plasma. Anal Chem. 1999;71:2340–5. doi: 10.1021/ac981294y. [DOI] [PubMed] [Google Scholar]
- Yang L, Amad M, Winnik WM, et al. Investigation of an enhanced resolution triple quadrupole mass spectrometer for high-throughput liquid chromatography/tandem mass spectrometry assays. Rapid Commun Mass Spectrom. 2002;16:2060–6. doi: 10.1002/rcm.824. [DOI] [PubMed] [Google Scholar]
- Jemal M, Ouyang Z. Enhanced resolution triple-quadrupole mass spectrometry for fast quantitative bioanalysis using liquid chromatography/tandem mass spectrometry: investigations of parameters that affect ruggedness. Rapid Commun Mass Spectrom. 2003;17:24–38. doi: 10.1002/rcm.872. [DOI] [PubMed] [Google Scholar]
- Onorato JM, Henion JD, Lefebvre PM, Kiplinger JP. Selected reaction monitoring LC-MS determination of idoxifene and its pyrrolidinone metabolite in human plasma using robotic high-throughput, sequential sample injection. Anal Chem. 2001;73:119–25. doi: 10.1021/ac000845t. [DOI] [PubMed] [Google Scholar]
- Zweigenbaum J, Henion J. Bioanalytical high-throughput selected reaction monitoring-LC/MS determination of selected estrogen receptor modulators in human plasma: 2000 samples/day. Anal Chem. 2000;72:2446–54. doi: 10.1021/ac991413p. [DOI] [PubMed] [Google Scholar]
- Chen YL, Hanson GD, Jiang X, Naidong W. Simultaneous determination of hydrocodone and hydromorphone in human plasma by liquid chromatography with tandem mass spectrometric detection. J Chromatogr B Analyt Technol Biomed Life Sci. 2002;769:55–64. doi: 10.1016/s1570-0232(01)00616-x. [DOI] [PubMed] [Google Scholar]
- Zhang H, Henion J. Quantitative and qualitative determination of estrogen sulfates in human urine by liquid chromatography/tandem mass spectrometry using 96-well technology. Anal Chem. 1999;71:3955–64. doi: 10.1021/ac990162h. [DOI] [PubMed] [Google Scholar]
- Thomas A, Sigmund G, Guddat S, et al. Determination of selected stimulants in urine for sports drug analysis by solid phase extraction via cation exchange and means of liquid chromatography-tandem mass spectrometry. Eur J Mass Spectrom. 2008;14:135–43. doi: 10.1255/ejms.925. [DOI] [PubMed] [Google Scholar]
- Kirkpatrick DS, Gerber SA, Gygi SP. The absolute quantification strategy: a general procedure for the quantification of proteins and post-translational modifications. Methods. 2005;35:265–73. doi: 10.1016/j.ymeth.2004.08.018. [DOI] [PubMed] [Google Scholar]
- Arnott D, Kishiyama A, Luis EA, et al. Selective detection of membrane proteins without antibodies: a mass spectrometric version of the western blot. Mol Cell Proteomics. 2002;1:148–56. doi: 10.1074/mcp.m100027-mcp200. [DOI] [PubMed] [Google Scholar]
- Barnidge DR, Dratz EA, Martin T, et al. Absolute quantification of the G protein-coupled receptor rhodopsin by LC/MS/MS using proteolysis product peptides and synthetic peptide standards. Anal Chem. 2003;75:445–51. doi: 10.1021/ac026154+. [DOI] [PubMed] [Google Scholar]
- Barnidge DR, Goodmanson MK, Klee GG, Muddiman DC. Absolute quantification of the model biomarker prostate-specific antigen in serum by LC-Ms/MS using protein cleavage and isotope dilution mass spectrometry. J Proteome Res. 2004;3:644–52. doi: 10.1021/pr049963d. [DOI] [PubMed] [Google Scholar]
- Anderson NL, Anderson NG. The human plasma proteome: history, character, and diagnostic prospects. Mol Cell Proteomics. 2002;1:845–67. doi: 10.1074/mcp.r200007-mcp200. [DOI] [PubMed] [Google Scholar]
- Domon B, Aebersold R. Mass spectrometry and protein analysis. Science. 2006;312:212–17. doi: 10.1126/science.1124619. [DOI] [PubMed] [Google Scholar]
- Taylor RL, Grebe SK, Singh RJ. Quantitative, highly sensitive liquid chromatography-tandem mass spectrometry method for detection of synthetic corticosteroids. Clin Chem. 2004;50:2345–52. doi: 10.1373/clinchem.2004.033605. [DOI] [PubMed] [Google Scholar]
- Gerber SA, Rush J, Stemman O, et al. Absolute quantification of proteins and phosphoproteins from cell lysates by tandem MS. Proc Natl Acad Sci USA. 2003;100:6940–5. doi: 10.1073/pnas.0832254100. [DOI] [PMC free article] [PubMed] [Google Scholar]
- Bowers GN, Jr, Fassett JD, White ET. Isotope dilution mass spectrometry and the national reference system. Anal Chem. 1993;65:475R–9R. doi: 10.1021/ac00060a620. [DOI] [PubMed] [Google Scholar]
- Schaeffer R, Fodor P, Soeroes C. Development of a liquid chromatography/electrospray selected reaction monitoring method for the determination of organoarsenic species in marine and freshwater samples. Rapid Commun Mass Spectrom. 2006;20:2979–89. doi: 10.1002/rcm.2672. [DOI] [PubMed] [Google Scholar]
- Botitsi E, Frosyni C, Tsipi D. Determination of pharmaceuticals from different therapeutic classes in wastewaters by liquid chromatography-electrospray ionization-tandem mass spectrometry. Anal Bioanal Chem. 2007;387:1317–27. doi: 10.1007/s00216-006-0804-8. [DOI] [PubMed] [Google Scholar]


