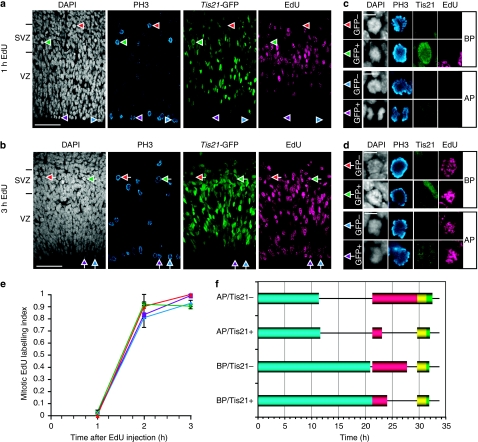
Figure 4. Time course of appearance of EdU label in proliferative and neurogenic mitotic APs and BPs.
(a–d) Phosphohistone H3 (PH3, blue), Tis21-GFP (green), DAPI (white) and EdU (magenta) staining after cumulative EdU labelling for 1 h (a, c) and 3 h (b, d). Examples of cells in mitosis, as identified by positive PH3 immunostaining (PH3+) plus mitotic appearance on DAPI staining (DAPI-m), are indicated by arrowheads in (a) and (b) and are shown at higher magnification in (c) and (d), respectively; red arrowheads, DAPI-m/PH3+/Tis21-GFP−/EdU− cell (BP); green arrowheads, DAPI-m/PH3+/Tis21-GFP+/EdU− cell (BP); blue arrowheads, DAPI-m/PH3+/Tis21-GFP−/EdU− cell (AP); purple arrowheads, DAPI-m/PH3+/Tis21-GFP+/EdU− cell (AP); red arrows, DAPI-m/PH3+/Tis21-GFP−/EdU+ cell (BP); green arrows, DAPI-m/PH3+/Tis21-GFP+/EdU+ cell (BP); blue arrows, DAPI-m/PH3+/Tis21-GFP−/EdU+ cell (AP); purple arrows, DAPI-m/PH3+/Tis21-GFP+/EdU+ cell (AP). VZ and SVZ are indicated on the left. Scale bars, 50 μm (a, b) and 10 μm (c, d). (e) Proportion of EdU-labelled mitotic cells (mitotic EdU labelling index) after cumulative EdU labelling for the indicated times. The mitotic EdU labelling index was separately determined for proliferative APs (apical Tis21-GFP− mitoses, blue diamonds), BP-genic/neurogenic APs (apical Tis21-GFP+ mitoses, purple squares), proliferative BPs (basal Tis21-GFP− mitoses, red triangles) and neurogenic BPs (basal Tis21-GFP+ mitoses, green crosses). Data are the mean of three (except 2 h: where the mean is of two fields) 450-μm wide fields (sum of two 225-μm fields), each from a different brain and litter; error bars indicate s.e.m. or the range of the two individual values. (f) Diagram showing the duration of the cell-cycle phases in each NPC population (see Table 1). Blue bars, G1-phase; red bars, S-phase; yellow bars, G2-phase; green bars, M-phase.

