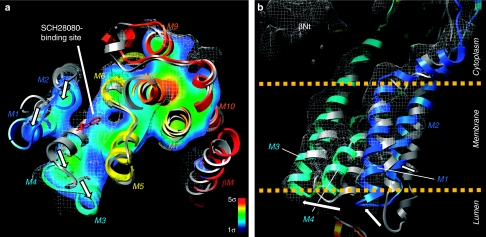
Figure 3. Rearrangement of TM helices induced by SCH28080 binding.
(a) Comparison of the TM helices between E2AlF and (SCH)E2BeF structures. A cross-section of the luminal TM region parallel to the membrane plane is viewed from the luminal side of the membrane. Mesh represents the EM density map (1σ) of (SCH)E2BeF, with homology models of (SCH)E2BeF (colour ribbons as in Fig. 1a) and E2AlF (grey ribbon)14 superimposed. A cross-section parallel to the membrane plane displays the contour level at the indicated plane (colour gradually changes from blue (1σ) to red (5σ) as indicated in the figure). White arrows indicate the conformational change of M1–M4 induced by the SCH28080 binding (red stick as in Fig. 1b). The position of the slice is indicated as a red box in Supplementary Fig. S4. (b) A view of the M1–M4 region perpendicular to the membrane plane showing inwardly swinging movement of the M1–M2 helix bundle (blue ribbon) along with an outwards movement of M3–M4 (cyan ribbon) compared with the E2AlF homology model (grey ribbon). Dotted lines indicate the approximate position of the lipid bilayer.

