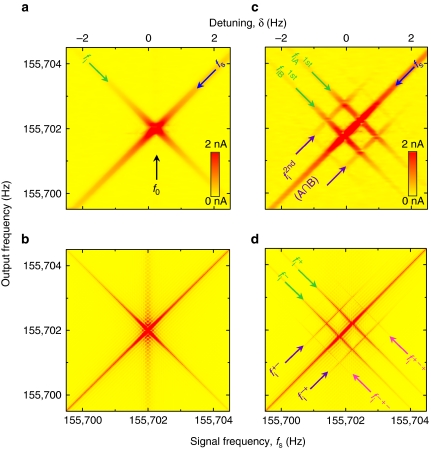
Figure 2. The mechanical idler dynamics.
(a) The response of the mechanical oscillator measured via the lock-in amplifier with fp=2f0+Δ where Δ=0 Hz and fs=f0+δ reveals the fundamental mode fs and the idler fi=f0−δ. (b) The corresponding theoretical response generated from equation (9) (Methods). (c) The response of the mechanical oscillator measured via the lock-in amplifier, with fpA=2f0+Δ and fpB=2f0−Δ where Δ=0.5 Hz, and fs=f0+δ reveals, in addition to fs, the two first-order idlers  and
and  and two second-order idlers
  that can be used to implement mechanical logic gates. (d) The corresponding numerical simulation except equation (9) is modified to include two pumps, and all the higher order idlers are labelled (Methods). In all cases, the experimental response is broader than the numerical simulations because of an experimental resolution band width (RBW) of 50 mHz.

