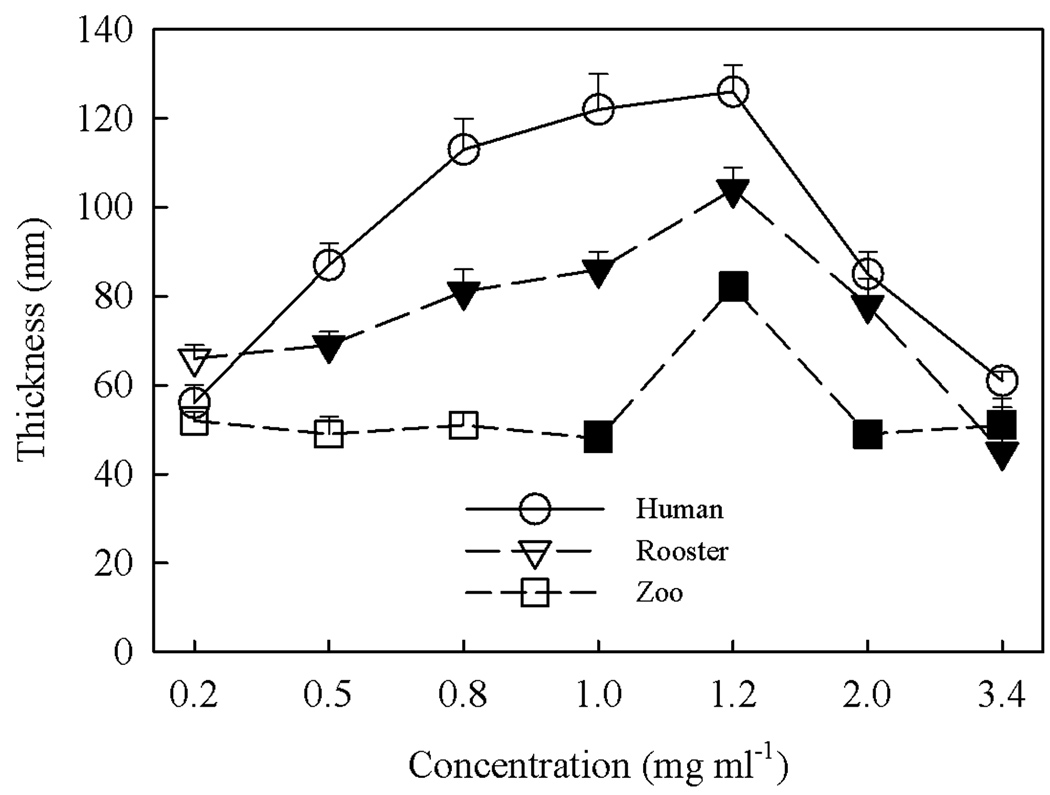
Figure 2.
Ellipsometric thickness (Å) of (●) human, (▽,▼) rooster comb and (□,■) streptococcus zooepidemicus NaHA grafted layers as a function of bulk substrate concentration during processing. Concentrations of NaHA in the dilute and semi-dilute regimes (i.e., below and above c*, the overlap concentration) for each specific species are delineated by open and solid symbols, respectively.

