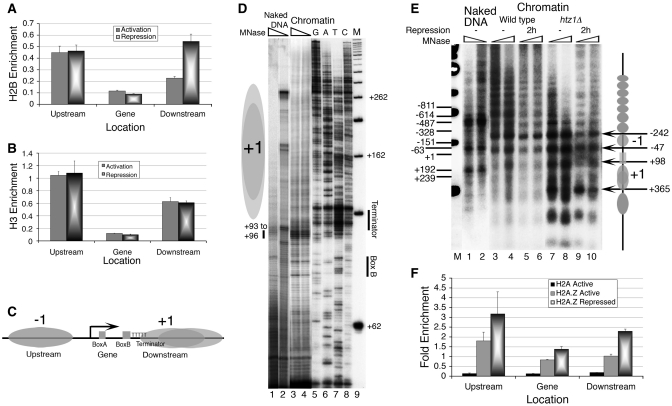
Figure 2.
Effect of Repression and H2A.Z deposition on the SUP4 gene locus in vivo. Chromatin organization at the SUP4 locus is probed by ChIP/Real Time PCR and footprinting methods. (A) Relative occupancy of FLAG-tagged H2B. (B) Relative occupancy of Myc-tagged H3. (C) Nucleosomes flank the histone-free SUP4 gene: Cartoon showing positions of the nucleosomes −1 and +1, relative to the cis elements of the gene, as marked in the panel 1C. (D) High-resolution MNase footprinting in vivo. MNase digested chromatin and naked DNA samples were used for extension with a primer which hybridizes to the bottom strand, 13 bp downstream of the TSS. Lane M shows a 50 bp ladder used as molecular size marker while GATC represent the sequencing reaction over genomic DNA. Two levels of MNase digestions are shown for SUP4 as naked DNA (lanes 1 and 2) and chromatin (lanes 3 and 4). Positions of the box B and terminator are marked while grey ovals represent nucleosomes. Position of MNase hypersensitivity immediate upstream of the terminator is marked with a short vertical bar in the left-hand side. (E) Low-resolution chromatin structure analysis by the IEL method. Grey ovals denote the nucleosomal size protections and arrows mark the MNase cut sites in the chromatin. Gene region is marked with a rectangle. All numbers represent bp with respect to TSS at +1. Numbers on the left-hand side mark the MNase cuts seen on the naked DNA in lanes 1 and 2. Numbers on the right-hand side mark the MNase cuts seen on chromatin and −1, +1 mark the gene flanking nucleosomes. MNase cleavage pattern of wild type (lanes 3–6) and Htz1Δ cells (lanes 7–10) without (lanes 3, 4 and 7, 8) or with nutritional stress (lanes 5, 6 and 9, 10) for 2 h is shown. (F) H2A.Z deposition in the nucleosomes around the SUP4 gene in vivo. Relative occupancies of FLAG-tagged H2A and H2A.Z on SUP4 against TELVIR region are shown. H2A.Z levels increase with repression.

