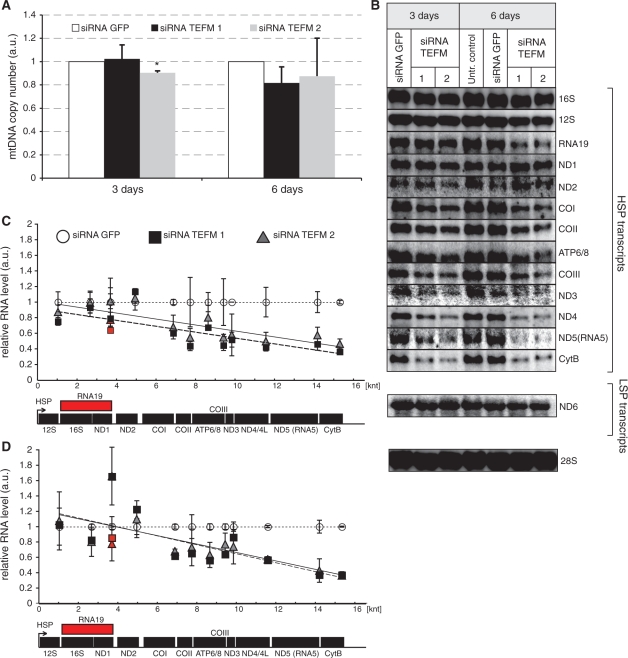
Figure 3.
Steady-state levels of mtDNA and mitochondrial transcripts in cells with inactivated TEFM. (A) mtDNA copy number as measured by comparative qPCR of the mitochondrial Cox2 gene and single copy nuclear gene (APP) in controls (Untransfected and siRNA GFP) and cells treated with TEFM siRNA (siRNA TEFM 1 and 2). *P < 0.05, n = 3, error bars indicate 1 SD. (B) Northern blot analyses of mitochondrial transcripts transcribed from the HSP1 or LSP promoter in control cells (untransfected and treated with GFP siRNA) and cells treated with TEFM siRNA for 3 or 6 days. Nuclear 28S rRNA was used as a loading control. (C and D) Quantification of steady-state levels of the H-strand mitochondrial transcripts in cells treated with TEFM siRNA for 3 days (C) and 6 days (D) analysed by northern blots. The values of the relative RNA level (mtRNA/28S rRNA) were obtained by quantifying PhosphoImager scans of blots in the ImageQuant software and normalized for the values obtained for control cells transfected with siRNA GFP. The relative RNA level of each transcript for siRNA TEFM 1 (square) and 2 (triangle) was plotted in the function of the distance of its 3′ end from HSP. Dotted line, trend for siRNA GFP control; solid line, trend for siRNA TEFM 1; dashed line, trend for siRNA TEFM 2. Red symbols indicate the RNA19 transcript. n = 3, error bars = 1 SD. The P-values (two-tailed Student’s t-test) for each transcript calculated for combined values for both TEFM siRNAs for 3 days: 12S = 0.103, 16S = 0.719, RNA19 = 0.124, ND1 = 0.492, ND2 = 0.234, COI = 0.009, COII = 0.031, ATP6/8 = 0.064, COIII = 0.023, ND3 = 0.890, ND4/4L = 0.006, ND5 = 0.007, CytB < 0.001, ND6 = 0.502; and for 6 days: 12S = 0.813, 16S = 0.092, RNA19 = 0.187, ND1 = 0.026, ND2 = 0.285, COI = 0.003, COII = 0.129, ATP6/8 = 0.025, COIII = 0.027, ND3 = 0.169, ND4/4L < 0.001, ND5 = 0.002, CytB < 0.001, ND6 = 0.137. The quantification of the steady-state level of the ND6 transcript that is transcribed from LSP is shown in Supplementary Figure S2.

