Figure 5.
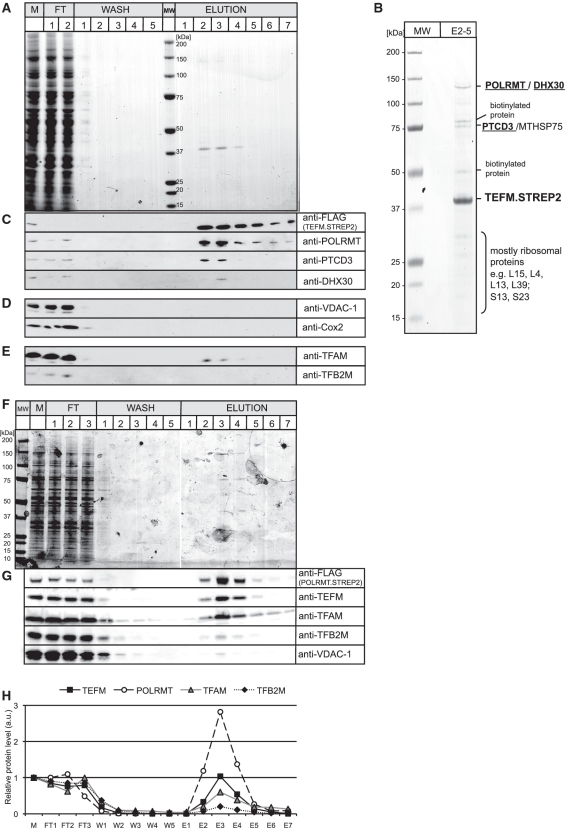
Mitochondrial RNA polymerase co-purifies with TEFM. (A) A SDS–PAGE gel stained with Coomassie Brilliant Blue showing the protein profile of the affinity purification of the TEFM.STREP2 from the mitochondria of HEK cells. The most intense protein band of ∼40 kDa seen in the elution fractions 2–4 corresponds to the purified TEFM.STREP2 protein. M, total mitochondrial lysate; FT, flow-through; MW, Molecular weight marker. (B) A SDS–PAGE gel stained with Coomassie Brilliant Blue with concentrated fractions from 2 to 5 (E2–5). Protein bands were cut from the gel and analysed by mass spectrometry. The identities of the protein are shown on the left-hand side. Some endogenous mitochondrial biotinylated proteins (e.g. 3-hydroxyacyl-CoA dehydrogenase α-subunit or hydroxyacyl dehydrogenase, subunit B) were detected in the analysis as affinity purification system used here is based on the interaction between the STREP2 tag and engineered streptavidin (Strep-Tactin), which also binds biotin. Only biotinylated proteins were detected in mock affinity capture experiments performed on parental HEK cells (data not shown). The presence of the mitochondrial chaperone protein, MTHSP75, in our preparation could well result from a mitochondrial stress response caused by overexpression of TEFM (41). (C)–(E) Western blots confirming the identity of the proteins that co-purify with TEFM that were detected by mass spectrometry (C) or documenting that there was no enrichment of highly abundant mitochondrial proteins (D) or mitochondrial proteins involved in the initiation of mtDNA transcription (E). (F) A SDS–PAGE gel stained with Coomassie Brilliant Blue showing the protein profile of the affinity purification of the POLRMT.STREP2 from the mitochondria of HEK cells. The most intense protein band of ∼140 kDa seen in the elution fractions 3–4 corresponds to the purified POLRMT.STREP2 protein. M, total mitochondrial lysate; FT, flow-through; MW, Molecular weight marker. (G) Western blots illustrating the protein profile of the affinity purification of the POLRMT.STREP2 from the mitochondria of HEK cells. (H) Relative abundance of proteins that co-purify with POLRMT.STREP2. The values were obtained by quantifying PhosphoImager scans of western blots from (G) in the ImageQuant software and normalized for the values obtained for the total mitochondrial lysate.

