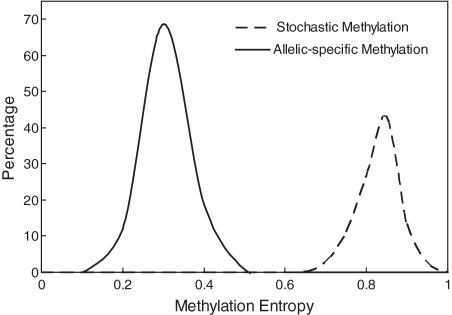
Figure 2.
The distribution of methylation entropy for simulation results. For a genomic locus with four CpG dinucleotides and average methylation level as 50%, 10 000 methylation data sets were generated. Each data set comprised of 16 sequence reads with four CpG sites per read. The dashed curve represents simulation result for stochastic methylation event. For 10 000 data sets, the methylation entropy ranged from 0.54 to 0.97 with average as 0.80. The solid curve represents simulation result for allelic-specific methylation as an example of deterministic methylation event. For 10 000 data sets, the methylation entropy ranged from 0.24 to 0.52 with average as 0.35.

