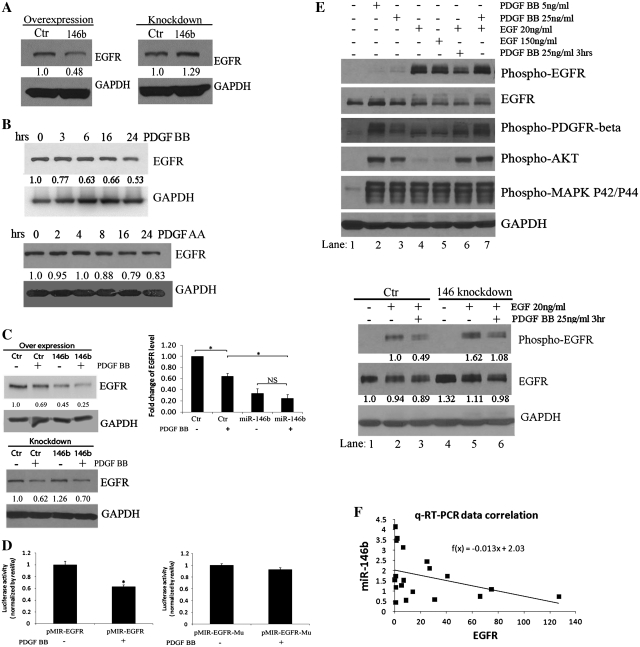
Figure 5.
MiR-146b targets the EGFR. (A) Western blotting for EGFR in U118MG cells transfected with miR-146b precursor or control (left) or with LNA targeting miR-146b or scrambled LNA (right). (B) Western blotting for EGFR in C272/hTert/E7 cells treated with PDGF-BB for 3–24 h (upper panel). Western blotting for EGFR in C272/hTert/E7 cells treated with PDGF-AA for 2–24 h (lower panel). (C) Western blotting assessed EGFR expression in C272/hTERT/E7 cells treated with PDGF-BB for 6 h after transfection of miR-146b precursor or control leading to miR-146b over-expression. Densitometry quantifies EGFR expression levels relative to GAPDH in independent experiments. Statistical significance is indicated by asterisks (upper panels, NS, not significant). Reporter assay measured the activity of an EGFR 3′-UTR-luciferase construct before and after stimulation with 50 ng/ml of PDGF-BB (lower panels). Reporter activity of wild-type EGFR 3′-UTR (left) and mutated 3′-UTR (right) were measured and normalized to renilla activity. Statistical significance is marked by asterisks; NS, non-significant. (D) Phosphorylation of PDGFRβ, EGFR, Akt and MAPK p42/p44 were measured by western blotting (upper panel) in C272hTert/E7 cells stimulated for 30 min with PDGF BB (5 ng/ml, lane 2 and 25 ng/ml, lane 3), EGF (20 ng/ml, lane 4 and 150 ng/ml, lane 5) or a combination of PDGF and EGF (pre-treatment with PDGF for 3 h, followed by EGF; lane 6; or concomitant stimulation with PDGF and EGF for 30 min; lane 7). Phosphorylation of EGFR and total expression of EGFR were measured by Western blotting in C272hTert/E7 cells (lower panel) transfected with LNA targeting miR-146b or control. Cells were then treated with EGF (20 ng/ml, lanes 2 and 5) or with PDGF for 3 h prior to stimulation with EGF (lanes 3 and 6). Densitometry quantifies EGFR phosphorylation and total expression relative to GAPDH. (E) EGFR and miR-146b relative expression plot obtained by using relative expression data after standardization of EGFR relative expression values and miR-146b. F(x) is the estimated linear trend function.

