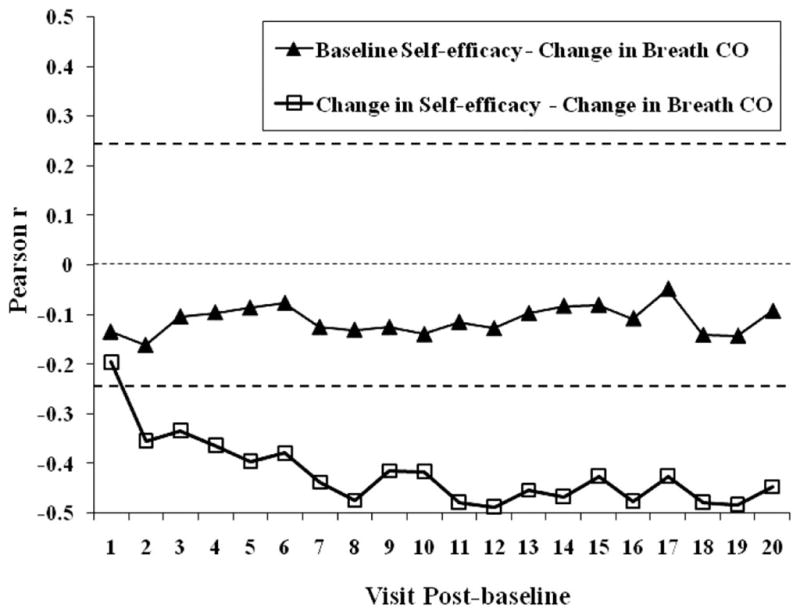
Figure 3.

Pearson correlation coefficients as a function of visits (postbaseline) in a contingency management smoking cessation program. Closed triangles represent correlations between the baseline measure of smoking cessation self-efficacy and the change in breath carbon monoxide (CO) levels over 20 consecutive postbaseline visits. Open squares represent correlations between the change in smoking cessation self-efficacy ratings at baseline and postbaseline Visit 20, and the change in breath CO levels over 20 consecutive postbaseline visits. Points above the upper dashed horizontal lines and below the lower dashed horizontal line are statistically significant at p < .05. The middle dashed line represents a correlation coefficient equal to zero.
