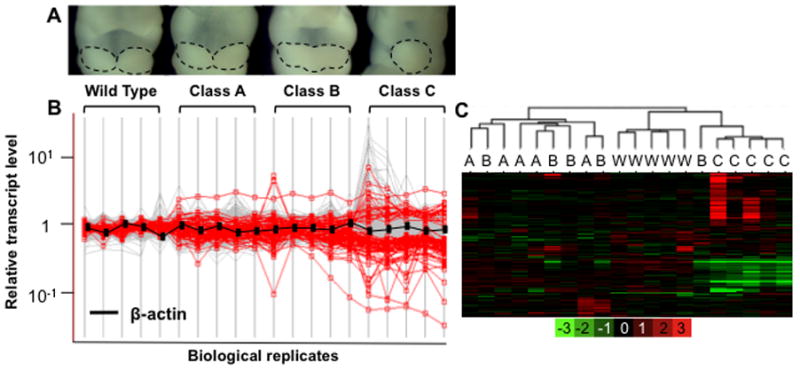
Figure 1. Association between phenotypic classes and expression differences.

(A) Morphological differences between phenotypic classes of E10.5 embryos are displayed. Dotted lines outline the mandibular components of BA1. (B): Gene expression levels are expressed on a log10 scale (y-axis) vs. an average of WT samples (Y=1) for a given gene. Each vertical line represents a biological replicate from given phenotypic classes (WT, A, B, or C). Genes that are differentially expressed between WT and class C, based on a fold change of 1.5 fold or greater and a false discovery rate of 10% or less, are highlighted (red). Compared with WT gene expression levels, variation is greatest in the most severely affected embryos (class C). (C) Unsupervised hierarchical clustering of array data. Class C samples are clearly separated from WT and class A samples. Class B represents an intermediate phenotype, clustering alternatively with either A or C. The log2 scale of the expression values is shown in the key at the bottom.
