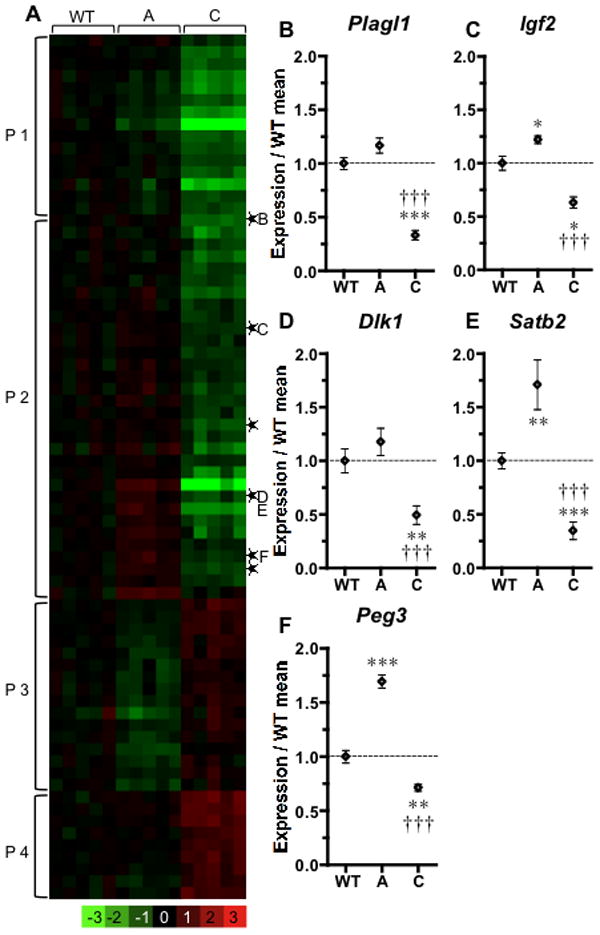
Figure 4. Gene expression differences between unaffected and severely affected mutants.

(A) A heatmap of expression changes in various phenotypic classes was compared to the average of WT. Genes with expression changes >1.5 fold and with a false discovery rate of <10% are presented as rows. ▯Imprinted genes. (B–F) Q-PCR confirmation. Significance levels in comparison with WT (*) or with class A (†); three symbols represent p<0.001; two, p<0.01; one, p<0.05.
