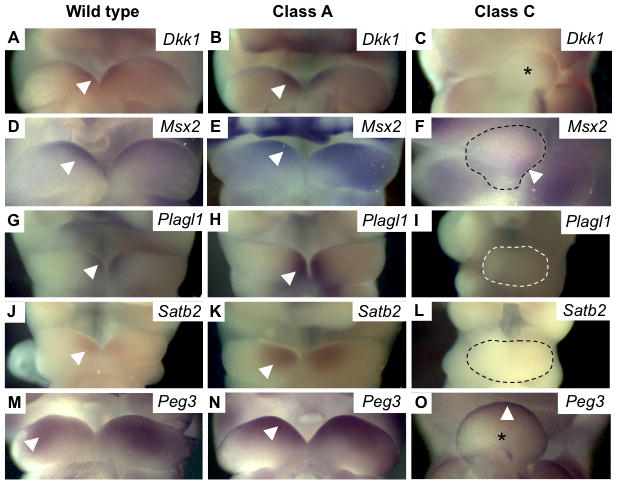
Figure 5. Validation of differential gene expression by in situ hybridization.

Photomicrographs of embryos from different phenotype classes, probed by in situ hybridization for (A–C) Dkk1 and (D–F) Msx2, show similar expression levels between WT and class A, but profoundly decreased expression in class C. (G–I) Plagl1, (J–L) Satb2 and (M–O) Peg3 show increased expression in class A and markedly decreased expression in class C. These represent various patterns of differential gene expression as described in the text. Arrowheads indicate expression domains within BA1. Fused mandibular prominences of BA1 are either marked with an asterisk or outlined with a dashed line.
