
Figure 3.
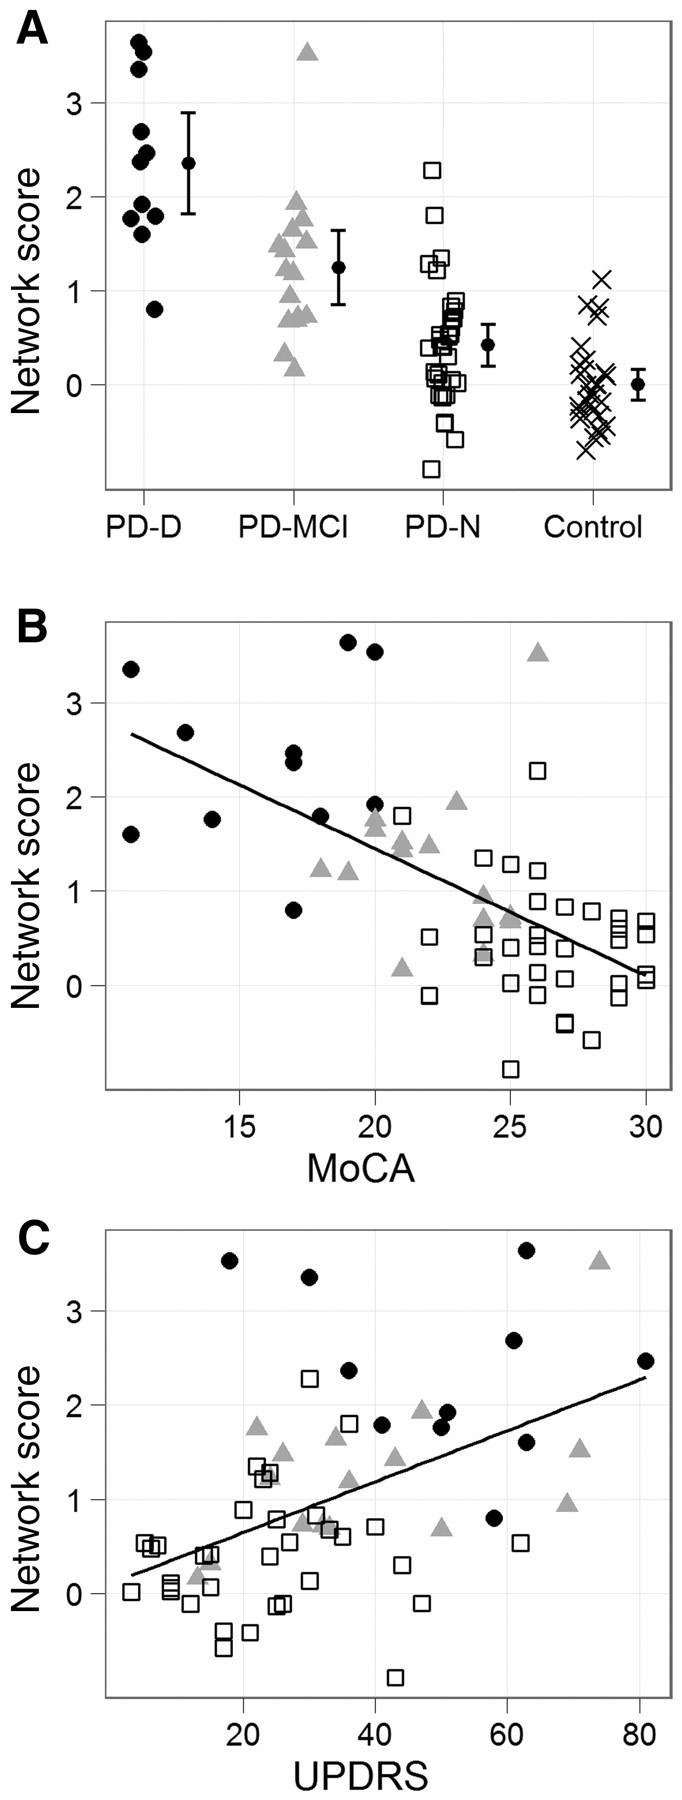
Network score in relation to cognition and motor impairment. (A) Network score by cognitive group, with 95% CI of the mean. Filled circles represent Parkinson’s disease with dementia (PD-D); grey triangles, Parkinson’s disease with mild cognitive impairment (PD-MCI); open squares, Parkinson’s disease with normal cognition (PD-N); and crosses, controls. Score increased monotonically from controls through subjects with Parkinson’s disease with normal cognition and Parkinson’s disease with mild cognitive impairment, with Parkinson’s disease with dementia exhibiting the highest value. Mean of the controls was set to zero. (B) Network score versus MoCA in Parkinson’s disease (r = −0.61, P < 0.001, slope = −0.135 network score/MoCA point) showing increased network score with decreasing global cognitive status. (C) Network score versus UPDRS-III (motor score) in Parkinson’s disease (r = 0.49, P < 0.001, slope = 0.027 network score/UPDRS-III point) depicting increased network score with more severe motor impairment.