
Table 3.
Interpretation of the characteristic Parkinson’s disease-related perfusion network
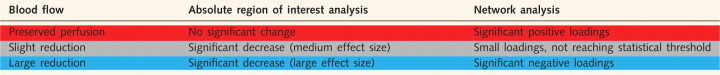 |
The table describes blood flow in Parkinson’s disease based on absolute, arterial spin labelling-derived perfusion and network analysis. The first column describes blood flow status in Parkinson’s disease in the red, grey and blue regions of Fig. 2A. The absolute region of interest analysis column describes the state of perfusion when tested using absolute arterial spin labelling-derived perfusion, while the third column describes these three regions relatively, in terms of loadings derived from network analysis. Our interpretation of the identified characteristic Parkinson’s disease-related pattern is informed by these absolute perfusion values.