
Figure 5.
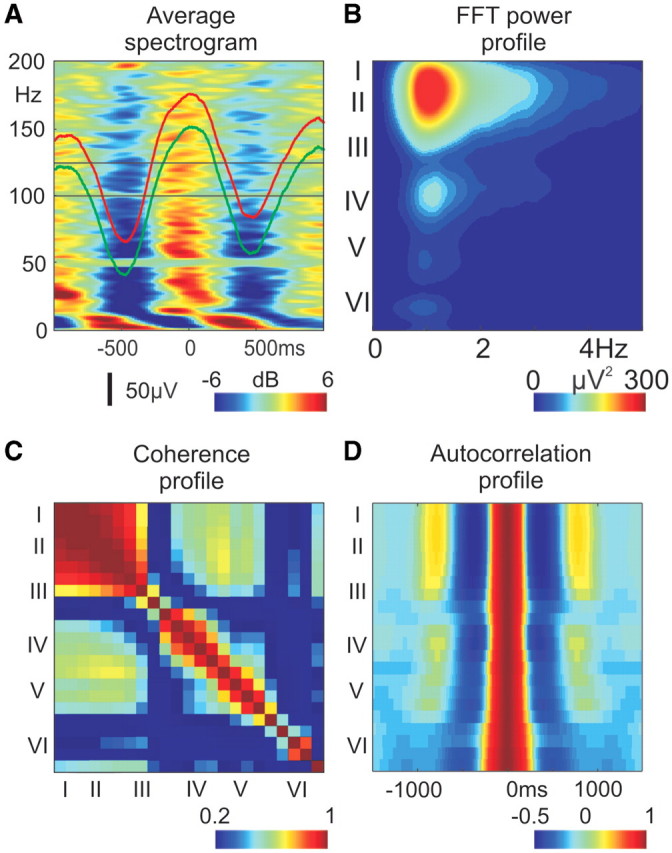
Spectro-temporal and spatial properties of slow wave activity, representative data from Patient 3. (A) Increased broadband spectral activity during up-states: up-state locked, averaged, relative spectrogram of layer II LFP gradient (x-axis: time, y-axis: frequency, z-axis: colour-coded averaged relative spectral power in dB). For the neighbouring ECoG, the averaged relative spectrogram is depicted in Supplementary Fig. 5A. Red (LFP gradient) and green (ECoG) traces show the average potentials. (B) Depth distribution profile of the LFP gradient fast Fourier transformation power spectrum (EEG range: 0.1–300 Hz data, no additional digital filtering was used, x-axis: frequency, y-axis: cortical depth, with corresponding layers, z-axis: colour-coded fast Fourier transformation power). For more power spectrum examples, see Supplementary Fig. 5B. (C) Depth distribution profile of pairwise coherence of LFP gradient channels in different cortical layers. x-axis: cortical depth, with corresponding layers, y-axis: cortical depth, with corresponding layers, z-axis: colour-coded pairwise coherence of the band-pass (0.3–3 Hz) LFP gradient. For more pairwise coherence examples, see Supplementary Fig. 5C. (D) Depth distribution profile of LFP gradient autocorrelation. x-axis: time, y-axis: cortical depth, with corresponding layers, z-axis: colour-coded autocorrelation of the LFP gradient. For more laminar autocorrelation examples, see Supplementary Fig. 5D.