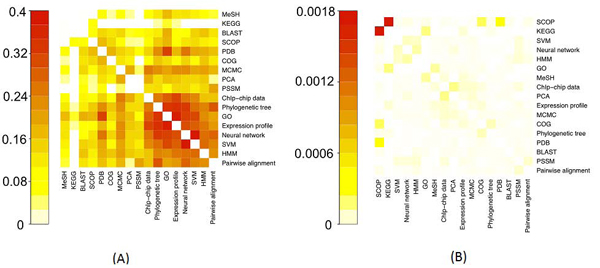
Figure 4.

Heatmap representations of the matrix of shared descriptor similarity scores between resources (method 2). (A) The scores based on binary weights. (B) The scores based on tf*idf. Heatmaps generated by R function ‘heatmap’ [20]. Note that the heatmap diagonals (self-similarity) are intentionally left white to make them easier to interpret, and that the heatmaps are different scales.
