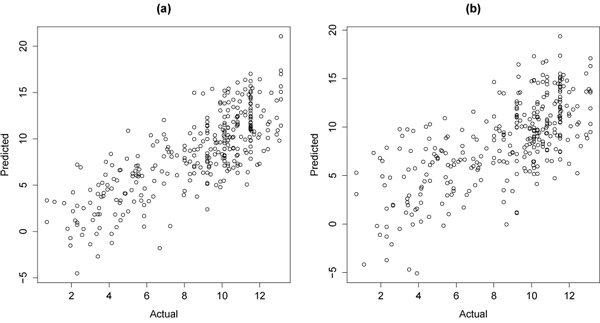
Figure 11.

Actual versus predicted values for a IC50 prediction model. The sub figures show: a) when assay confidence was taken into consideration, and b) when assay confidence was not taken into consideration. The reduced variance of the predicted values suggests that including assay confidence is beneficial to the model’s performance. The prediction model is given in Equation 1.
