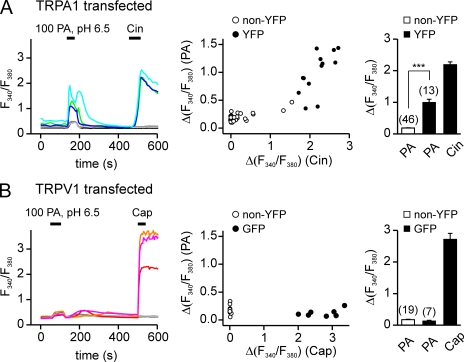
Figure 8.
PA activates TRPA1 in Ca2+ imaging. Agonist-induced elevation of intracellular Ca2+ in HEK-293 cells transfected with TRPV1 or TRPA1. (A) TRPA1-expressing HEK cells responded to both 100 mM PA, pH 6.5, and 100 µM Cin. (B) TRPV1-expressing HEK cells responded only to 1 µM Cap and showed nonspecific responses to PA. Scatter plot shows the amplitude of the responses to PA as a function of the responses to Cin (A) or Cap (B). Average responses to PA and Cin (A) or PA and Cap (B) are shown in the bar graph. Data are represented by the mean ± SEM. Significance was determined with the two-tailed Student’s t test. ***, P < 0.001.

