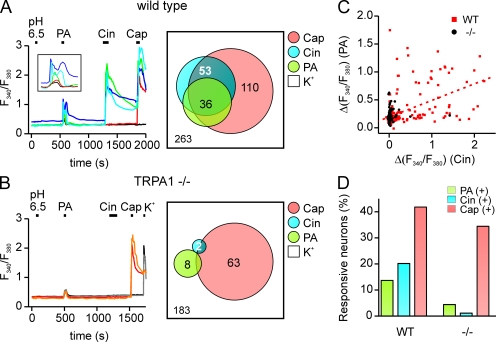
Figure 9.
Responses of TG neurons to weak acids are TRPA1 depedent. (A) Elevation of intracellular Ca2+ in sensory neurons isolated from the TG of wild-type mice in response to weak acids and other agonists. Traces illustrate the different types of responses observed: cells responsive to PA, Cin, and Cap (but not to 10 mM HEPES, pH 6.5) are shown with green, blue, and cyan traces; a cell responsive to Cap, but not to Cin or PA, is shown in red; and a cell that responded to none of the agonists is shown in black. (B) TG neurons from TRPA1 knockout mice showed only reduced sensitivity to PA and Cin but retained normal responses to Cap (orange and red traces). Venn diagrams show the aggregate results from all experiments. Numbers represent a total count of the responsive cells to each agonist, and overlap and size of each circle are drawn to scale. (C) Summary data from experiments as in A and B showing the magnitude of the PA response as a function of the Cin response in the same cell. Note that the PA response was positively correlated with the magnitude of the Cin response in cells from wild-type mice (r = 0.52 and P < 0.0001). (D) The percentage of different populations of TG neurons in cultures from wild-type and TRPA1 knockout mice.

