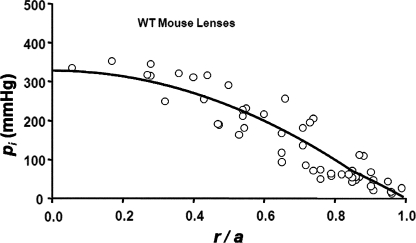
Figure 3.
The standing hydrostatic pressure gradient in lenses from WT mice, which were ∼2 mo old. The hydrostatic pressure (pi mmHg) is graphed as a function of normalized distance (r/a) from the lens center, where a (cm) is the lens radius, and r (cm) is the distance from the lens center. The data are from 14 lenses from seven mice. The pressures at two to six radial locations were recorded from each lens. The smooth curve is the best fit of Eq. 7 to the data.

