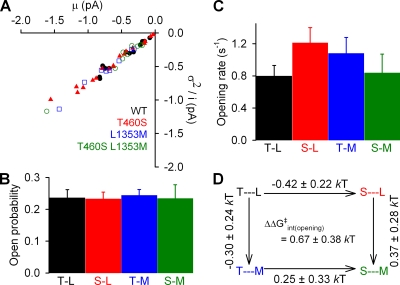
Figure 3.
Effect of mutations at positions 460 and 1353 on channel opening rates. (A) The same records used for determining burst duration (see Fig. 2) were used for noise analysis. Each data point represents one recording. (B) Mean ± SEM of Po values estimated for each patch from the corresponding data point in A (see Materials and methods). (C) Mean ± SEM of opening rates calculated for each patch using the estimate for Po (see B) and the closing rate (see Fig. 2 B). (D) Thermodynamic mutant cycle for target pair T460-L1353 built on opening rates (from C); notation as in Fig. 2 C.

