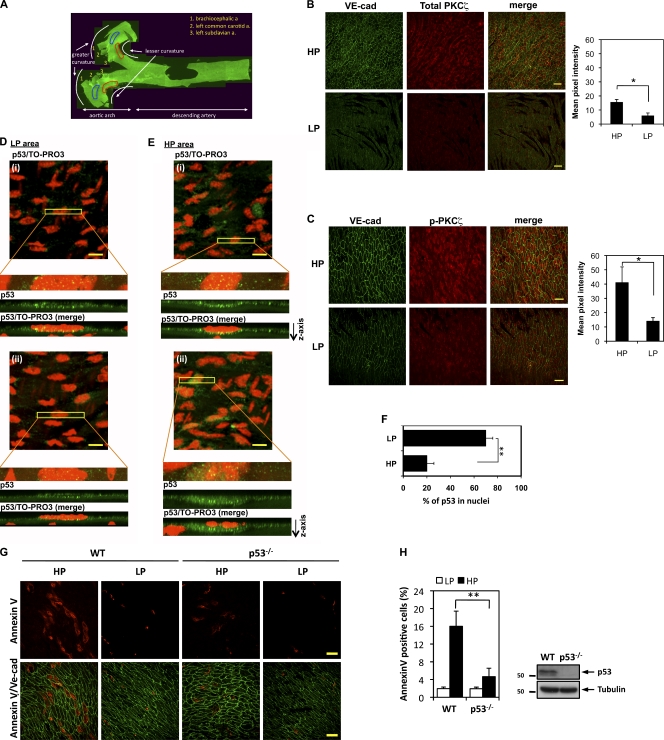
Figure 10.
Increases in phosphorylated and total PKCζ and nonnuclear p53 expression within the d-flow regions (HP areas) and decreased apoptosis in ECs of p53−/− mice. (A) A representative epifluorescence image of the whole specimen. Fixed aortas of wild-type mice were cut longitudinally, and the arch region was further cut into two halves. Areas of d-flow (HP area; lesser curvature) are outlined in red, and neighboring areas of s-flow (LP area) are lined in blue. a, artery. (B and C) En face preparations were double stained with anti–VE-cadherin (VE-cad; used as an EC marker) and an anti–total PKCζ antibody (B) or phospho-PKCζ T560 antibody (C). X-y axis images were collected at 0.5-µm increments so that a z stack of ∼4-µm thickness from the luminal surface was obtained. From each image background, fluorescence intensity was subtracted, and the pixel number of the stained region per unit area of the endothelium in HP and LP area within the aortic arch was determined (n = 3). Areas of d-flow (HP areas; lesser curvature) show both increased total and phospho-PKCζ expression compared with the neighboring areas of s-flow (LP area). Bars, 20 µm. Bar graphs show quantification of total (B) and phospho (C)-PKCζ in HP and LP areas. Data are shown as means ± SEM; *, P < 0.05. (D and E) Increased cytoplasmic p53 localization in HP area ECs. Aortic arches were immunostained for endothelial p53 (green). Nuclei were stained using TO-PRO3 (red). From initial stacked x-y axis images (top), a narrow rectangular area crossing an EC was selected for x-y-z scanning at 0.1-µm increments. Images below the clipped images show rectangular z-axis images. Two representative sets of images (i and ii) are shown for LP (D) and HP (E) areas. Bars, 10 µm. (F) Quantification of nuclear p53. The pixel number of nuclear and nonnuclear regions per cell was determined, and the ratio of nuclear/total intensity was calculated from 60 cells from each HP and LP area (four cells/field, five fields/mouse, and a total of three mice). (G) The number of d-flow–mediated annexin V–positive cells (red) in the HP area is decreased in the mice deficient for p53 (p53 knockout) compared with the wild-type mouse aorta. Anti–VE-cadherin staining (green) was used as a marker for ECs. Bars, 100 µm. (H, left) Quantification of apoptotic cells. Percentages of annexin V–positive cells in LP and HP areas determined from 7-wk wild-type and p53-deficient mice (n = 3 each) are shown. In HP area, the number of annexin V–positive cells are significantly decreased in the p53 knockout compared with the wild type. **, P < 0.01. (right) Deletion of p53 was confirmed by Western blotting with anti-p53 using a lung protein lysate. Molecular masses are given in kilodaltons. Data are shown as means ± SEM. WT, wild type.

