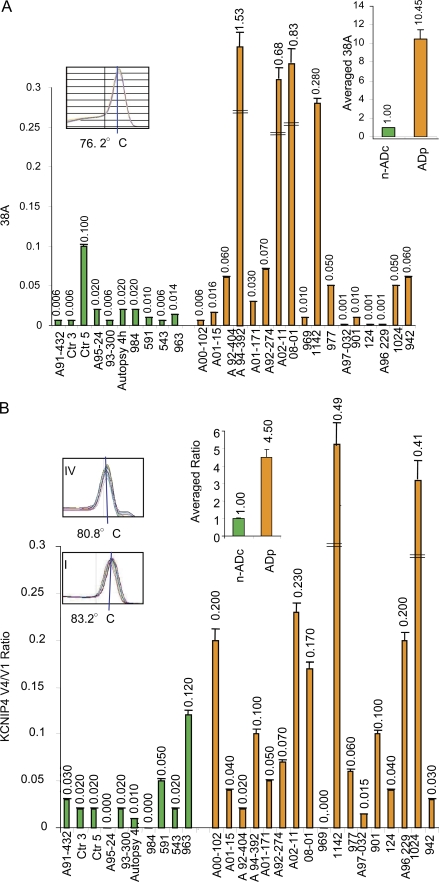
Figure 7.
ncRNA expression and alternative splicing in AD cases. (A) 38A expression in AD cases (orange bars) and nADc individuals (green bars) as determined by quantitative real-time RT-PCR. AD cases 124 and 1,024 have a familiar genetic origin. The amplification product dissociation curves unambiguously distinguish the RNAs of interest by peaks at specific temperatures (insets). Error bars represent SD of three independent real-time RT-PCR determinations. The averaged results are also reported. (B) Real-time RT-PCR quantitative detection of KCNIP4 splice variant synthesis in AD patients and nADc individuals. Results are reported as the splice variant ratio (KCNIP4 Var IV vs. Var I). Error bars represent SD of three independent real-time RT-PCR determinations. The averaged ratios are also reported. The dissociation curves (insets) show that the splice variants of interest are unambiguously distinguishable by peaks at specific temperatures. DSE, distal sequence element.

